RightDataUSA

Demographics and Elections Commentary

6/29/2025: How Conservative is Your House Rep? A Comparison of CPAC Ratings and RightDataUSA.com Ratings [RightDataUSA]


Photo credit: CPAC.org

There is more to a congressman than his voting record -- there is his role in sponsoring or facilitating legislation; his role in various committees and subcommittees; providing services for his constituents, and other duties. Only the voting record provides a significant amount of quantifiable data about where he stands on the important issues of the day. Congress takes numerous votes over the course of a year. Many votes are not even officially tabulated -- these are "voice votes" -- but others ("roll-call votes") require an explicit enumeration of the Yeas and Nays.

In 2024 there were 516 roll-call votes conducted in the U.S. House of Representatives. Many of these were on topics that are frivolous, or they pertain to issues on which the correct position is so obvious as to be almost unanimously supported by our elected representatives. Some of these frivolous or obvious votes included:


Billie Jean King Congressional Gold Medal Act for the purpose of "recognition of her courageous and groundbreaking leadership" in being a non-heterosexual female who participated in professional athletics (paving the way for today's WNBA, though we are aware of no evidence that Ms. King was a hardcore racist against Whites). Also, at the age of 29, she once beat a 55-year old man in a highly publicized tennis match.

Enhanced Presidential Security Act, which was passed in September after a few assassination attempts were made against one particular 2024 presidential candidate. Even the most Trump-hating Democrats didn't want to be on the record against this bill (it passed 405-0).

A mandate for alarmist labeling on packages of pre-moistened baby wipes, a clear-cut issue of major importance which 56 Republican meanies still voted against.


The majority of House votes each year are far from frivolous, and there are hundreds of them. Therefore it is not possible for voters to keep detailed balance sheets in their heads regarding how each congressman voted.

Various special interest organizations such as the AFL-CIO, ACLU, League of Conservation Voters, pro-abortionist groups and numerous others (not all of them are on the left) try to help their followers know which politicians they should like and which they should hate, by producing narrowly-focused ratings of congressmen every year. These groups select a tiny subset of votes which are of interest to them, and they grade members of Congress based on the percentage of the time the member's vote aligned with the wishes of the group doing the rating.

There are two groups which produce more broadly-based ratings -- Americans for Democratic Action (ADA) on the left, and CPAC (formerly known as the American Conservative Union) on the right. Neither of these organizations exactly provide up-to-the-minute data; the ADA has published one set of yearly ratings since 2021, and here in June of 2025 CPAC has finally released its ratings for 2024.

Like all other ratings organizations, both of these groups identify certain important ("key") votes and compute the percentage of the time that each congressman voted their way. CPAC selected 23 key votes which took place in the House in 2024, and has issued ratings based on those votes.


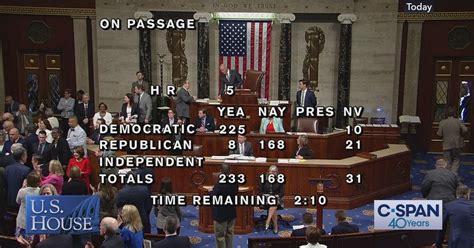
Photo credit: c-span.org

At RightDataUSA.com, we have a complete record of CPAC/ACU key votes and their results going all the way back to 1970, which is when the ACU began issuing ratings. We have also created our own ratings, based on likely ACU criteria, for the years 1961-1969 for those who are interested in ancient history.

More pertinently, we generate our own House ratings during each year, while those two higher-profile organizations do not release their data until well into the following year (if at all, in the case of the ADA). Our source for data is voteview.com, which is typically updated every few weeks and contains information on every roll-call vote taken in Congress. Aside from identifying what we consider to be key votes, we use this data to calculate Party Unity scores along with the percentage of the time each representative actually showed up for work (their Voting Percentage). An example is shown here, for Representative Elise Stefanik (R-NY)

Explanations of the various columns are provided underneath the data table. The numbers in the last two columns represent the percentage of the time which Stefanik voted liberal (according to the ADA) or conservative (according to CPAC). These numbers, for recent years, are linked to their corresponding data sets. For example, click on the number "71" in the "Conserv." column for the year 2024, and you will be taken to a page which lists all 23 CPAC key votes -- one of which was so important to them that it is double-counted -- and how Stefanik voted on those 23 issues. Her rating of "71" means that CPAC believes she voted the conservative position 71% of the time in 2024.

As noted in the explanations, the liberal and conservative figures for a year do not necessarily add to 100% because ADA and CPAC use different sets of key votes for their evaluations.

Click through to this page to see details regarding all CPAC key votes for 2024. The subject of the first one was the Biden administration exempting electric vehicle chargers from "Buy American" requirements. Stefanik voted the right way on this issue. To see how the entire House voted, click on the Result ("Passed 209-198"):

Vote Data for SJRES38 (118th Congress) Subject: Waiver of Buy American Requirements for Electric Vehicle Chargers

That page is sorted by Yeas/Nays by default, but can also be sorted alphabetically, or by party or state. A green check next to a member's name indicates that he voted the right way; a red X means that member voted the wrong way. There are pages such as this on RightDataUSA.com for every single key House vote since 1961, but probably few users have discovered them up to now.


While updating the pages of all 2024 House members to reflect the recently-released CPAC figures, we noticed that in many cases their ratings deviated from our own ratings by a substantial amount. The table below displays data for each congressman -- the CPAC rating, the RightDataUSA.com rating and the aggregate rating (a combination of CPAC ratings and ours).

Right at the top of the chart is one good example of this divergence: Alaska representative Mary Peltola, a Democrat who was defeated for re-election last November, was assigned a 53% conservative rating by us for 2024 but only 22% by CPAC. Peltola, as a Democrat from a supposedly solid "red" state, was forced to masquerade as a moderate in order to have any chance of returning to the House for a second term; she came close but lost by 2.4%.

How conservative was she, really? Note that even 22% is a very high conservative rating for a Democrat these days and 53% is stratospheric. In the event of a major difference between our rating and CPAC's rating, the truth typically lies somewhere in between. Peltola's aggregate rating was 40% for 2024.

District 2024 Rep. Our
Rating
CPAC
Rating
Aggregate
AK-00 Mary Peltola (D) 53% 22% 40%
AL-01 Jerry Carl (R) 92% 74% 85%
AL-02 Barry Moore (R) 100% 96% 98%
AL-03 Mike Rogers (R) 82% 67% 76%
AL-04 Robert Aderholt (R) 85% 70% 79%
AL-05 Dale Strong (R) 87% 75% 83%
AL-06 Gary Palmer (R) 97% 96% 97%
AL-07 Terri Sewell (D) 0% 0% 0%
AR-01 Rick Crawford (R) 87% 70% 81%
AR-02 French Hill (R) 85% 71% 79%
AR-03 Steve Womack (R) 85% 63% 76%
AR-04 Bruce Westerman (R) 95% 83% 90%
AZ-01 David Schweikert (R) 95% 83% 90%
AZ-02 Eli Crane (R) 92% 96% 94%
AZ-03 Ruben Gallego (D) 27% 5% 19%
AZ-04 Greg Stanton (D) 13% 4% 10%
AZ-05 Andy Biggs (R) 95% 96% 95%
AZ-06 Juan Ciscomani (R) 87% 54% 74%
AZ-07 Raul Grijalva (D) 0% 0% 0%
AZ-08 Debbie Lesko (R) 95% 88% 92%
AZ-09 Paul Gosar (R) 97% 100% 98%
CA-01 Doug LaMalfa (R) 94% 91% 93%
CA-02 Jared Huffman (D) 8% 0% 5%
CA-03 Kevin Kiley (R) 87% 54% 75%
CA-04 Mike Thompson (D) 3% 0% 2%
CA-05 Tom McClintock (R) 87% 92% 89%
CA-06 Ami Bera (D) 0% 4% 2%
CA-07 Doris Matsui (D) 5% 0% 3%
CA-08 John Garamendi (D) 0% 0% 0%
CA-09 Josh Harder (D) 20% 5% 14%
CA-10 Mark DeSaulnier (D) 8% 0% 5%
CA-11 Nancy Pelosi (D) 0% 0% 0%
CA-12 Barbara Lee (D) 10% 0% 6%
CA-13 John Duarte (R) 82% 68% 77%
CA-14 Eric Swalwell (D) 8% 0% 5%
CA-15 Kevin Mullin (D) 5% 0% 3%
CA-16 Anna Eshoo (D) 3% 0% 2%
CA-17 Ro Khanna (D) 11% 0% 7%
CA-18 Zoe Lofgren (D) 11% 0% 6%
CA-19 Jimmy Panetta (D) 13% 4% 10%
CA-20 Vince Fong (R) 100% 67% 87%
CA-21 Jim Costa (D) 8% 13% 10%
CA-22 David Valadao (R) 84% 55% 73%
CA-23 Jay Obernolte (R) 84% 70% 78%
CA-24 Salud Carbajal (D) 0% 0% 0%
CA-25 Raul Ruiz (D) 3% 0% 2%
CA-26 Julia Brownley (D) 0% 0% 0%
CA-27 Mike Garcia (R) 83% 64% 75%
CA-28 Judy Chu (D) 5% 0% 3%
CA-29 Tony Cardenas (D) 8% 0% 5%
CA-30 Adam Schiff (D) 3% 0% 2%
CA-31 Grace Napolitano (D) 5% 0% 3%
CA-32 Brad Sherman (D) 5% 0% 3%
CA-33 Pete Aguilar (D) 0% 0% 0%
CA-34 Jimmy Gomez (D) 3% 0% 2%
CA-35 Norma Torres (D) 3% 0% 2%
CA-36 Ted Lieu (D) 6% 0% 4%
CA-37 Sydney Kamlager (D) 8% 0% 5%
CA-38 Linda Sanchez (D) 0% 0% 0%
CA-39 Mark Takano (D) 8% 4% 6%
CA-40 Young Kim (R) 85% 57% 74%
CA-41 Ken Calvert (R) 85% 58% 75%
CA-42 Robert Garcia (D) 8% 0% 5%
CA-43 Maxine Waters (D) 5% 0% 3%
CA-44 Nanette Barragan (D) 3% 0% 2%
CA-45 Michelle Steel (R) 87% 71% 81%
CA-46 Lou Correa (D) 5% 4% 5%
CA-47 Katie Porter (D) 9% 0% 6%
CA-48 Darrell Issa (R) 92% 67% 82%
CA-49 Mike Levin (D) 13% 4% 10%
CA-50 Scott Peters (D) 3% 4% 3%
CA-51 Sara Jacobs (D) 11% 0% 7%
CA-52 Juan Vargas (D) 8% 0% 5%
CO-01 Diana DeGette (D) 5% 0% 3%
CO-02 Joe Neguse (D) 0% 0% 0%
CO-03 Lauren Boebert (R) 95% 95% 95%
CO-04 Greg Lopez (R) 93% 100% 95%
CO-04 Ken Buck (R) 71% 86% 79%
CO-05 Doug Lamborn (R) 78% 75% 77%
CO-06 Jason Crow (D) 0% 0% 0%
CO-07 Brittany Pettersen (D) 3% 0% 2%
CO-08 Yadira Caraveo (D) 33% 25% 30%
CT-01 John Larson (D) 3% 0% 2%
CT-02 Joe Courtney (D) 5% 8% 6%
CT-03 Rosa DeLauro (D) 0% 0% 0%
CT-04 Jim Himes (D) 3% 4% 3%
CT-05 Jahana Hayes (D) 10% 4% 8%
DE-00 Lisa Blunt Rochester (D) 0% 0% 0%
FL-01 Matt Gaetz (R) 97% 95% 96%
FL-02 Neal Dunn (R) 88% 74% 82%
FL-03 Kat Cammack (R) 95% 83% 90%
FL-04 Aaron Bean (R) 95% 96% 95%
FL-05 John Rutherford (R) 85% 75% 81%
FL-06 Michael Waltz (R) 89% 90% 89%
FL-07 Cory Mills (R) 92% 91% 92%
FL-08 Bill Posey (R) 95% 100% 97%
FL-09 Darren Soto (D) 13% 0% 8%
FL-10 Maxwell Frost (D) 10% 4% 8%
FL-11 Daniel Webster (R) 95% 79% 89%
FL-12 Gus Bilirakis (R) 97% 95% 97%
FL-13 Anna Paulina Luna (R) 97% 95% 96%
FL-14 Kathy Castor (D) 8% 4% 6%
FL-15 Laurel Lee (R) 89% 88% 89%
FL-16 Vern Buchanan (R) 85% 65% 77%
FL-17 Greg Steube (R) 97% 100% 98%
FL-18 Scott Franklin (R) 89% 75% 84%
FL-19 Byron Donalds (R) 97% 91% 95%
FL-20 Sheila McCormick (D) 5% 0% 3%
FL-21 Brian Mast (R) 97% 83% 92%
FL-22 Lois Frankel (D) 6% 0% 4%
FL-23 Jared Moskowitz (D) 20% 4% 14%
FL-24 Frederica Wilson (D) 0% 0% 0%
FL-25 Debbie Wasserman-Schultz (D) 3% 0% 2%
FL-26 Mario Diaz-Balart (R) 83% 52% 72%
FL-27 Maria Salazar (R) 84% 59% 75%
FL-28 Carlos Gimenez (R) 84% 71% 79%
GA-01 Buddy Carter (R) 87% 65% 79%
GA-02 Sanford Bishop (D) 5% 8% 6%
GA-03 Drew Ferguson (R) 85% 77% 82%
GA-04 Hank Johnson (D) 0% 0% 0%
GA-05 Nikema Williams (D) 8% 0% 5%
GA-06 Rich McCormick (R) 92% 88% 90%
GA-07 Lucy McBath (D) 5% 0% 3%
GA-08 Austin Scott (R) 85% 79% 83%
GA-09 Andrew Clyde (R) 95% 100% 97%
GA-10 Mike Collins (R) 97% 96% 97%
GA-11 Barry Loudermilk (R) 95% 96% 95%
GA-12 Rick Allen (R) 95% 88% 92%
GA-13 David Scott (D) 15% 0% 10%
GA-14 Marjorie Taylor Greene (R) 97% 96% 97%
HI-01 Ed Case (D) 5% 8% 6%
HI-02 Jill Tokuda (D) 5% 0% 3%
IA-01 Mariannette Miller-Meeks (R) 84% 68% 78%
IA-02 Ashley Hinson (R) 85% 59% 75%
IA-03 Zach Nunn (R) 85% 57% 75%
IA-04 Randy Feenstra (R) 90% 75% 84%
ID-01 Russ Fulcher (R) 95% 92% 94%
ID-02 Mike Simpson (R) 91% 50% 75%
IL-01 Jonathan Jackson (D) 13% 0% 8%
IL-02 Robin Kelly (D) 0% 0% 0%
IL-03 Delia Ramirez (D) 10% 0% 6%
IL-04 Chuy Garcia (D) 8% 0% 5%
IL-05 Mike Quigley (D) 6% 0% 3%
IL-06 Sean Casten (D) 0% 0% 0%
IL-07 Danny Davis (D) 6% 0% 3%
IL-08 Raja Krishnamoorthi (D) 0% 0% 0%
IL-09 Jan Schakowsky (D) 10% 0% 6%
IL-10 Brad Schneider (D) 3% 0% 2%
IL-11 Bill Foster (D) 3% 4% 3%
IL-12 Mike Bost (R) 97% 83% 92%
IL-13 Nikki Budzinski (D) 15% 4% 11%
IL-14 Lauren Underwood (D) 0% 0% 0%
IL-15 Mary Miller (R) 97% 96% 97%
IL-16 Darin LaHood (R) 87% 83% 85%
IL-17 Eric Sorensen (D) 26% 5% 18%
IN-01 Frank Mrvan (D) 15% 4% 11%
IN-02 Rudy Yakym (R) 95% 79% 89%
IN-03 Jim Banks (R) 95% 96% 95%
IN-04 Jim Baird (R) 97% 79% 90%
IN-05 Victoria Spartz (R) 94% 96% 95%
IN-06 Greg Pence (R) 89% 67% 80%
IN-07 Andre Carson (D) 0% 0% 0%
IN-08 Larry Bucshon (R) 87% 65% 79%
IN-09 Erin Houchin (R) 90% 79% 86%
KS-01 Tracey Mann (R) 95% 83% 90%
KS-02 Jake LaTurner (R) 86% 74% 81%
KS-03 Sharice Davids (D) 15% 4% 11%
KS-04 Ron Estes (R) 92% 83% 89%
KY-01 James Comer (R) 95% 90% 93%
KY-02 Brett Guthrie (R) 87% 75% 83%
KY-03 Morgan McGarvey (D) 8% 0% 5%
KY-04 Thomas Massie (R) 90% 95% 92%
KY-05 Harold Rogers (R) 84% 56% 75%
KY-06 Andy Barr (R) 84% 79% 82%
LA-01 Steve Scalise (R) 84% 74% 81%
LA-02 Troy Carter (D) 3% 0% 2%
LA-03 Clay Higgins (R) 100% 100% 100%
LA-04 Mike Johnson (R) 89% 81% 87%
LA-05 Julia Letlow (R) 92% 74% 85%
LA-06 Garret Graves (R) 92% 71% 84%
MA-01 Richard Neal (D) 3% 0% 2%
MA-02 James McGovern (D) 10% 0% 6%
MA-03 Lori Trahan (D) 3% 0% 2%
MA-04 Jake Auchincloss (D) 5% 0% 3%
MA-05 Katherine Clark (D) 3% 0% 2%
MA-06 Seth Moulton (D) 5% 0% 3%
MA-07 Ayanna Pressley (D) 11% 0% 7%
MA-08 Stephen Lynch (D) 8% 5% 7%
MA-09 William Keating (D) 0% 4% 2%
MD-01 Andy Harris (R) 95% 92% 94%
MD-02 Dutch Ruppersberger (D) 0% 0% 0%
MD-03 John Sarbanes (D) 3% 0% 2%
MD-04 Glenn Ivey (D) 3% 0% 2%
MD-05 Steny Hoyer (D) 0% 0% 0%
MD-06 David Trone (D) 0% 0% 0%
MD-07 Kweisi Mfume (D) 5% 0% 3%
MD-08 Jamie Raskin (D) 3% 0% 2%
ME-01 Chellie Pingree (D) 8% 0% 5%
ME-02 Jared Golden (D) 61% 36% 52%
MI-01 Jack Bergman (R) 95% 67% 84%
MI-02 John Moolenaar (R) 92% 67% 83%
MI-03 Hillary Scholten (D) 13% 4% 10%
MI-04 Bill Huizenga (R) 92% 68% 84%
MI-05 Tim Walberg (R) 92% 83% 89%
MI-06 Debbie Dingell (D) 10% 0% 6%
MI-07 Elissa Slotkin (D) 18% 4% 13%
MI-08 Dan Kildee (D) 8% 5% 7%
MI-09 Lisa McClain (R) 89% 88% 88%
MI-10 John James (R) 86% 57% 75%
MI-11 Haley Stevens (D) 3% 0% 2%
MI-12 Rashida Tlaib (D) 8% 0% 5%
MI-13 Shri Thanedar (D) 8% 0% 5%
MN-01 Brad Finstad (R) 97% 83% 92%
MN-02 Angie Craig (D) 31% 4% 21%
MN-03 Dean Phillips (D) 9% 0% 6%
MN-04 Betty McCollum (D) 0% 0% 0%
MN-05 Ilhan Omar (D) 10% 0% 7%
MN-06 Tom Emmer (R) 87% 83% 86%
MN-07 Michelle Fischbach (R) 97% 83% 92%
MN-08 Pete Stauber (R) 92% 77% 87%
MO-01 Cori Bush (D) 11% 0% 7%
MO-02 Ann Wagner (R) 86% 57% 75%
MO-03 Blaine Luetkemeyer (R) 93% 68% 83%
MO-04 Mark Alford (R) 97% 88% 94%
MO-05 Emanuel Cleaver (D) 0% 0% 0%
MO-06 Sam Graves (R) 86% 76% 82%
MO-07 Eric Burlison (R) 95% 96% 95%
MO-08 Jason Smith (R) 95% 88% 92%
MS-01 Trent Kelly (R) 90% 75% 84%
MS-02 Bennie Thompson (D) 0% 0% 0%
MS-03 Michael Guest (R) 92% 79% 87%
MS-04 Mike Ezell (R) 90% 78% 85%
MT-01 Ryan Zinke (R) 92% 83% 88%
MT-02 Matt Rosendale (R) 92% 96% 94%
NC-01 Don Davis (D) 56% 21% 43%
NC-02 Deborah Ross (D) 5% 0% 3%
NC-03 Greg Murphy (R) 81% 76% 79%
NC-04 Valerie Foushee (D) 8% 0% 5%
NC-05 Virginia Foxx (R) 90% 75% 84%
NC-06 Kathy Manning (D) 10% 4% 8%
NC-07 David Rouzer (R) 85% 83% 84%
NC-08 Dan Bishop (R) 100% 100% 100%
NC-09 Richard Hudson (R) 94% 71% 86%
NC-10 Patrick McHenry (R) 81% 75% 79%
NC-11 Chuck Edwards (R) 92% 63% 80%
NC-12 Alma Adams (D) 5% 0% 3%
NC-13 Wiley Nickel (D) 15% 4% 11%
NC-14 Jeff Jackson (D) 14% 4% 10%
ND-00 Kelly Armstrong (R) 97% 79% 90%
NE-01 Mike Flood (R) 85% 71% 79%
NE-02 Don Bacon (R) 82% 52% 70%
NE-03 Adrian Smith (R) 86% 79% 84%
NH-01 Chris Pappas (D) 18% 5% 13%
NH-02 Ann Kuster (D) 3% 5% 3%
NJ-01 Donald Norcross (D) 9% 0% 5%
NJ-02 Jeff Van Drew (R) 97% 79% 90%
NJ-03 Andy Kim (D) 0% 0% 0%
NJ-04 Chris Smith (R) 90% 58% 78%
NJ-05 Josh Gottheimer (D) 16% 4% 11%
NJ-06 Frank Pallone (D) 16% 0% 10%
NJ-07 Tom Kean, Jr. (R) 85% 50% 71%
NJ-08 Rob Menendez (D) 3% 0% 2%
NJ-09 Bill Pascrell (D) 0% 7% 3%
NJ-10 LaMonica McIver (D) 0% 0% 0%
NJ-10 Donald Payne, Jr. (D) 0% 0% 0%
NJ-11 Mikie Sherrill (D) 6% 5% 5%
NJ-12 Bonnie Coleman (D) 9% 0% 6%
NM-01 Melanie Stansbury (D) 5% 0% 3%
NM-02 Gabriel Vasquez (D) 8% 8% 8%
NM-03 Teresa Fernandez (D) 5% 0% 3%
NV-01 Dina Titus (D) 8% 4% 7%
NV-02 Mark Amodei (R) 92% 57% 79%
NV-03 Susie Lee (D) 24% 5% 16%
NV-04 Steven Horsford (D) 26% 4% 18%
NY-01 Nick LaLota (R) 84% 50% 70%
NY-02 Andrew Garbarino (R) 85% 50% 71%
NY-03 Thomas Suozzi (D) 17% 0% 12%
NY-04 Anthony D'Esposito (R) 86% 54% 74%
NY-05 Gregory Meeks (D) 3% 0% 2%
NY-06 Grace Meng (D) 11% 0% 7%
NY-07 Nydia Velazquez (D) 11% 0% 7%
NY-08 Hakeem Jeffries (D) 3% 0% 2%
NY-09 Yvette Clarke (D) 5% 0% 3%
NY-10 Daniel Goldman (D) 3% 0% 2%
NY-11 Nicole Malliotakis (R) 86% 79% 84%
NY-12 Jerrold Nadler (D) 10% 0% 6%
NY-13 Adriano Espaillat (D) 11% 0% 6%
NY-14 Alexandria Octavio-Cortez (D) 11% 0% 6%
NY-15 Ritchie Torres (D) 11% 0% 6%
NY-16 Jamaal Bowman (D) 13% 0% 9%
NY-17 Mike Lawler (R) 84% 50% 70%
NY-18 Pat Ryan (D) 18% 4% 13%
NY-19 Marc Molinaro (R) 87% 59% 77%
NY-20 Paul Tonko (D) 5% 0% 3%
NY-21 Elise Stefanik (R) 87% 71% 81%
NY-22 Brandon Williams (R) 92% 58% 79%
NY-23 Nick Langworthy (R) 94% 81% 89%
NY-24 Claudia Tenney (R) 89% 96% 92%
NY-25 Joe Morelle (D) 0% 4% 2%
NY-26 Timothy Kennedy (D) 4% 0% 3%
NY-26 Brian Higgins (D) 0% 0% 0%
OH-01 Greg Landsman (D) 22% 4% 15%
OH-02 Brad Wenstrup (R) 85% 75% 81%
OH-03 Joyce Beatty (D) 5% 0% 3%
OH-04 Jim Jordan (R) 97% 96% 97%
OH-05 Bob Latta (R) 87% 75% 83%
OH-06 Bill Johnson (R) 100% 100% 100%
OH-06 Michael Rulli (R) 100% 80% 92%
OH-07 Max Miller (R) 87% 71% 81%
OH-08 Warren Davidson (R) 97% 96% 97%
OH-09 Marcy Kaptur (D) 18% 13% 16%
OH-10 Mike Turner (R) 79% 60% 72%
OH-11 Shontel Brown (D) 5% 0% 3%
OH-12 Troy Balderson (R) 89% 79% 85%
OH-13 Emilia Sykes (D) 11% 4% 8%
OH-14 David Joyce (R) 84% 50% 70%
OH-15 Mike Carey (R) 87% 75% 83%
OK-01 Kevin Hern (R) 97% 91% 95%
OK-02 Josh Brecheen (R) 95% 96% 95%
OK-03 Frank Lucas (R) 85% 63% 76%
OK-04 Tom Cole (R) 84% 59% 75%
OK-05 Stephanie Bice (R) 85% 63% 76%
OR-01 Suzanne Bonamici (D) 10% 0% 6%
OR-02 Cliff Bentz (R) 92% 71% 84%
OR-03 Earl Blumenauer (D) 9% 0% 5%
OR-04 Val Hoyle (D) 10% 4% 8%
OR-05 Lori Chavez-DeRemer (R) 82% 50% 69%
OR-06 Andrea Salinas (D) 16% 0% 10%
PA-01 Brian Fitzpatrick (R) 72% 38% 59%
PA-02 Brendan Boyle (D) 11% 8% 10%
PA-03 Dwight Evans (D) 11% 0% 7%
PA-04 Madeleine Dean (D) 3% 0% 2%
PA-05 Mary Gay Scanlon (D) 8% 0% 5%
PA-06 Chrissy Houlahan (D) 5% 8% 6%
PA-07 Susan Wild (D) 15% 4% 11%
PA-08 Matt Cartwright (D) 21% 9% 16%
PA-09 Dan Meuser (R) 92% 83% 88%
PA-10 Scott Perry (R) 97% 100% 98%
PA-11 Lloyd Smucker (R) 85% 75% 81%
PA-12 Summer Lee (D) 10% 0% 6%
PA-13 John Joyce (R) 95% 88% 92%
PA-14 Guy Reschenthaler (R) 87% 83% 86%
PA-15 Glenn Thompson (R) 87% 71% 81%
PA-16 Mike Kelly (R) 84% 71% 79%
PA-17 Chris DeLuzio (D) 13% 4% 10%
RI-01 Gabe Amo (D) 3% 0% 2%
RI-02 Seth Magaziner (D) 3% 0% 2%
SC-01 Nancy Mace (R) 95% 83% 90%
SC-02 Joe Wilson (R) 86% 75% 82%
SC-03 Jeff Duncan (R) 94% 90% 93%
SC-04 William Timmons (R) 97% 96% 97%
SC-05 Ralph Norman (R) 95% 100% 97%
SC-06 James Clyburn (D) 3% 0% 2%
SC-07 Russell Fry (R) 97% 96% 97%
SD-00 Dusty Johnson (R) 90% 74% 84%
TN-01 Diana Harshbarger (R) 97% 88% 94%
TN-02 Tim Burchett (R) 92% 92% 92%
TN-03 Chuck Fleischmann (R) 90% 67% 81%
TN-04 Scott DesJarlais (R) 100% 90% 96%
TN-05 Andy Ogles (R) 97% 96% 97%
TN-06 John Rose (R) 97% 86% 93%
TN-07 Mark E. Green (R) 95% 91% 93%
TN-08 David Kustoff (R) 89% 79% 85%
TN-09 Steve Cohen (D) 0% 4% 2%
TX-01 Nathaniel Moran (R) 87% 83% 86%
TX-02 Dan Crenshaw (R) 83% 65% 77%
TX-03 Keith Self (R) 95% 96% 95%
TX-04 Pat Fallon (R) 97% 83% 92%
TX-05 Lance Gooden (R) 97% 92% 95%
TX-06 Jake Ellzey (R) 85% 63% 76%
TX-07 Lizzie Fletcher (D) 0% 4% 2%
TX-08 Morgan Luttrell (R) 92% 79% 87%
TX-09 Al Green (D) 6% 0% 3%
TX-10 Michael McCaul (R) 86% 67% 79%
TX-11 August Pfluger (R) 90% 75% 84%
TX-12 Kay Granger (R) 85% 69% 79%
TX-13 Ronny Jackson (R) 95% 95% 95%
TX-14 Randy Weber (R) 97% 96% 97%
TX-15 Monica De La Cruz (R) 89% 74% 83%
TX-16 Veronica Escobar (D) 5% 0% 3%
TX-17 Pete Sessions (R) 86% 74% 81%
TX-18 Sheila Jackson-Lee (D) 20% 0% 12%
TX-18 Erica Lee Carter (D) 0% 0% 0%
TX-19 Jodey Arrington (R) 97% 91% 95%
TX-20 Joaquin Castro (D) 5% 0% 4%
TX-21 Chip Roy (R) 95% 100% 97%
TX-22 Troy Nehls (R) 97% 95% 96%
TX-23 Tony Gonzales (R) 85% 71% 79%
TX-24 Beth Van Duyne (R) 90% 96% 92%
TX-25 Roger Williams (R) 100% 95% 98%
TX-26 Michael Burgess (R) 86% 82% 85%
TX-27 Michael Cloud (R) 95% 95% 95%
TX-28 Henry Cuellar (D) 55% 33% 47%
TX-29 Sylvia Garcia (D) 5% 0% 3%
TX-30 Jasmine Crockett (D) 5% 0% 3%
TX-31 John Carter (R) 86% 61% 77%
TX-32 Colin Allred (D) 16% 8% 13%
TX-33 Mark Veasey (D) 5% 9% 6%
TX-34 Vicente Gonzalez (D) 43% 23% 36%
TX-35 Greg Casar (D) 10% 0% 6%
TX-36 Brian Babin (R) 92% 88% 90%
TX-37 Lloyd Doggett (D) 5% 0% 3%
TX-38 Wesley Hunt (R) 92% 95% 93%
UT-01 Blake Moore (R) 82% 58% 73%
UT-02 Celeste Maloy (R) 97% 71% 87%
UT-03 John Curtis (R) 92% 83% 89%
UT-04 Burgess Owens (R) 97% 75% 89%
VA-01 Rob Wittman (R) 89% 75% 84%
VA-02 Jen Kiggans (R) 85% 58% 75%
VA-03 Bobby Scott (D) 8% 0% 5%
VA-04 Jennifer McClellan (D) 3% 0% 2%
VA-05 Bob Good (R) 95% 100% 97%
VA-06 Ben Cline (R) 97% 96% 97%
VA-07 Abigail Spanbarger (D) 5% 4% 5%
VA-08 Don Beyer (D) 0% 0% 0%
VA-09 Morgan Griffith (R) 94% 91% 93%
VA-10 Jennifer Wexton (D) 3% 0% 2%
VA-11 Gerry Connolly (D) 0% 0% 0%
VT-00 Becca Balint (D) 8% 0% 5%
WA-01 Suzan DelBene (D) 8% 0% 5%
WA-02 Rick Larsen (D) 8% 4% 6%
WA-03 Marie Perez (D) 68% 39% 57%
WA-04 Dan Newhouse (R) 87% 61% 77%
WA-05 Cathy McMorris (R) 88% 90% 89%
WA-06 Derek Kilmer (D) 3% 0% 2%
WA-07 Pramila Jayapal (D) 12% 0% 7%
WA-08 Kim Schrier (D) 18% 4% 13%
WA-09 Adam Smith (D) 3% 0% 2%
WA-10 Marilyn Strickland (D) 0% 0% 0%
WI-01 Brian Steil (R) 92% 79% 87%
WI-02 Mark Pocan (D) 11% 0% 7%
WI-03 Derrick Van Orden (R) 92% 79% 87%
WI-04 Gwen Moore (D) 9% 0% 5%
WI-05 Scott Fitzgerald (R) 95% 83% 90%
WI-06 Glen Grothman (R) 92% 79% 87%
WI-07 Tom Tiffany (R) 92% 96% 93%
WI-08 Tony Wied (R) 100% 100% 100%
WI-08 Mike Gallagher (R) 57% 63% 59%
WV-01 Carol Miller (R) 87% 88% 87%
WV-02 Alex Mooney (R) 97% 100% 98%
WY-00 Harriet Hageman (R) 97% 96% 97%


For 2024:

The average GOP representative received a rating of 79% from CPAC and 91% from RightDataUSA.com. The average Democrat representative received a rating of 2% from CPAC and 9% from RightDataUSA.com. The average House member received a rating of 41% from CPAC and 50% from RightDataUSA.com.

Why are the two sets of 2024 House ratings so different in many instances? Our evaluations skew to the right as compared to those of CPAC. Of the 441 representatives who participated in House votes in 2024, we assigned a higher conservative rating than CPAC to 353 of them; we assigned a lower rating to only 51 (37 received identical ratings from both sources).

Even though RightDataUSA.com and CPAC are approaching this subject from the same conservative perspective, there was surprisingly little agreement on what constituted a key vote in 2024. Between the 23 votes CPAC selected and the 39 we selected, there were only two which overlapped. Furthermore, there was a considerable differentiation in the type of key vote which was selected.

Each key vote can be assigned to one of the following categories:
  • Economic
  • Social
  • Foreign

Many key votes could easily be assigned to multiple categories (e.g. practically every vote has some economic component to it), however we limited all votes to a single classification. As one example, all key votes dealing with border control and/or illegal immigration are classified as Social rather than Foreign because it is much more of a social issue than one of foreign policy; but illegal immigration, like so many other vote topics, has a compelling economic impact as well.

CPAC's 23 key votes break down as:
  • 62.5% Economic
  • 29.2% Social
  • 8.3% Foreign

Our 39 key votes were distributed as:
  • 20.5% Economic
  • 59.0% Social
  • 20.5% Foreign

Once CPAC ratings are available for a particular year, we allow them to supersede our own ratings and therefore we display the CPAC data and remove ours (we may update the site to show both datasets shortly). Here is a listing of the 39 key House votes we selected for 2024:
  1. Denouncing the Biden administration's open-borders policies
  2. Impeaching Alejandro Mayorkas, Secretary of Homeland Security
  3. Extension of continuing appropriations for 2024
  4. Laken Riley Act
  5. Denouncing the Biden administration's immigration policies
  6. Protecting Americans from Foreign Adversary Controlled Applications Act
  7. Denouncing the Biden administration's anti-American energy policies
  8. Cutting Green Corruption and Taxes Act
  9. Prohibiting warrantless searches of U.S. personal communications in the FISA database
  10. Renewing FISA (the FBI's tool often used against conservatives) for 5 years
  11. Expanding prohibited disclosures of stored electronic communications
  12. Rescinding Biden's waiver of Iran sanctions
  13. End the Border Catastrophe Act
  14. "Emergency" spending on Ukraine
  15. Alaska's Right to Produce Act (also selected by CPAC as a key vote)
  16. Reinstating Migrant Protection Protocols
  17. Hands Off Our Home Appliances Act
  18. Equal Representation Act (also selected by CPAC as a key vote)
  19. DC CRIMES Act
  20. Security assistance for Israel
  21. Banning non-citizens from voting in DC elections
  22. Sanctions against the International Criminal Court
  23. Defense Department funding of sex change operations
  24. Defense Department funding of abortions
  25. Eliminating DEI in the Defense Department
  26. Requiring proof of citizenship to vote
  27. Finding Attorney General Merrick Garland in contempt
  28. Condemning "border czar" Kamala Harris for dereliction of duty
  29. Obedience to the World Health Organization
  30. Chinese spying and other issues pertaining to Communist China
  31. No Foreign Election Interference
  32. Violence Against Women by Illegal Aliens Act
  33. FY 2025 continuing resolution
  34. End Woke Higher Education
  35. No Bailout for Sanctuary Cities
  36. Accountability for key officials in the Biden-Harris administration
  37. Leaking the Ethics Committee report on Rep. Matt Gaetz
  38. Midnight Rules Relief Act
  39. American Relief Act

Is there any doubt that these votes were on issues which should be of great importance to conservatives? Why did CPAC omit 37 of these 39 votes? Are economic issues -- which they strongly lean towards -- really that much more important than other issues? Was there a desire by CPAC to choose a set of votes which would yield ratings that match their subjective evaluations of certain representatives? Or are we at RightDataUSA.com overemphasizing social issues and neglecting economics?

It should be apparent that the dual sets of votes were selected independently of each other -- during 2024 we had no idea which votes CPAC was considering and (unless they actually visit this site) they had no idea which votes we deemed to be critical.


In 2025 the pattern is similar. There are no CPAC ratings to compare to yet, and there probably won't be any until well into 2026. However our 2025 ratings of House members bear a strong resemblance to the ones we generated during 2024, in the sense of being noticeably to the right of what some folks might consider to be accurate.

So far in 2025 we have selected 20 House votes as being key ones. Republicans are for the most part so thoroughly united that nearly all of them score at about 90% -- and it would be closer to 100% if we reversed our position (which corresponds to CPAC's position) on the abominations known as Continuing Resolutions (CRs). These resolutions are a cowardly way for Congress to avoid passing an actual budget, thus allowing government spending, the burden on taxpayers and the national debt to continue to spiral out of control because -- so the politicians claim -- the only alternative is the dreaded Government Shutdown. All Republican politicians live in mortal fear of that, since the Democrat Propaganda Machine known as "the media" will ensure that blame is placed solely on one side of the aisle in the event of a so-called shutdown.

CPAC always opposes CRs, and so do we. The pair of CRs among our key votes in 2025 are the only ones in which Republicans as a group get a failing grade because they voted in favor; opposition Democrats therefore get a passing grade for opposing CRs, however ludicrous it may be that a majority of Democrats are assigned to the "right" side on anything.


If Republicans have majorities in the House and Senate (which they do) and if they are so united (which nearly all of them are) then why are those majorities not accomplishing more?

Clearly it's because those majorities are so extremely narrow.

The GOP has some ornery contrarians (like Rand Paul and Thomas Massie), grandstanding war-mongering pricks (like Lindsey Graham) and outright Democrats posing as Republicans (like Susan Collins and Lisa Murkowski). When only one or two votes are needed to thwart legislation, these people and others who occasionally behave like them rise to the occasion and become the liberal media's Queen For A Day. Other times, principled conservatives may refuse to be whipped into line on a particular piece of legislation because they will not concede that it is 15% good while being "only" 85% terrible, and the rebels may temporarily receive Strange New Respect from the media as a reward (a reward full of ulterior motives) for derailing something the media objects to.


Summary: It's a good idea to be able to evaluate congressmen to determine whether their performance in Congress is in line with the voters of their districts. Several organizations attempt do that, although most such organizations are ones which obsess over a single issue; therefore their ratings appeal only to voters who share that same obsession. A few organizations, including RightDataUSA.com, evaluate members of Congress over a wider range of issues that is based on a larger sample of votes. However, even groups who are on the same side of the political aisle can disagree about the level of liberalism or conservatism that is expressed via a sample of a congressman's votes. Here we have presented our ratings alongside those from CPAC, and readers can decide for themselves which ones to accept.

As we get closer to the 2026 midterms, these evaluations will take on greater significance and we will update our ratings as we did here in 2024. Urban Democrat congressmen must always guard their left flanks in primary elections lest a younger and more aggressive and hate-filled ultra-liberal challenge them. In other districts, Democrats are well aware that "moderation" (fraudulent though it is) is a sensible thing. In both types of districts, the degree to which incumbents are concerned with their re-election chances will be reflected in their votes.

On the Republican side, the GOP establishment is never interested in having more aggressive conservatives in Congress, and will help squishy incumbents with financing and by creating "paper conservatives" when necessary, to flood the primary ballot and split the right-wing vote. Even with all that GOPe assistance, supposedly vulnerable left-wing Republican incumbents normally run to the left as elections approach, and that will be apparent in their vote ratings too.

To make an educated choice, particularly in a primary election, smart voters will want to know everything they can about the person they are voting for -- or against.

Tags:

U.S. House Ratings CPAC


[More commentaries]