| 4/15/2025: U.S. House District Analysis -- What Are "PVIs"? [RightDataUSA] | |||||||||||||||||||||||||||||||||||||||||||||||||||||||||||||||||||||||||||||||||||||||||||||||||||||||||||||||||||||||||||||||||||||||||||||||||||||||||||||||||||||||||||||||||||||||||||||||||||||||||||||||||||||||||||||||||||||||||||||||||||||||||||||||||||||||||||||||||||||||||||||||||||||||||||||||||||||||||||||||||||||||||||||||||||||||||||||||||||||||||||||||||||||||||||||||||||||||||||||||||||||||||||||||||||||||||||||||||||||||||||||||||||||||||||||||||||||||||||||||||||||||||||||||||||||||||||||||||||||||||||||||||||||||||||||||||||||||||||||||||||||||||||||||||||||||||||||||||||||||||||||||||||||||||||||||||||||||||||||||||||||||||||||||||||||||||||||||||||||||||||||||||||||||||||||||||||||||||||||||||||||||||||||||||||||||||||||||||||||||||||||||||||||||||||||||||||||||||||||||||||||||||||||||||||||||||||||||||||||||||||||||||||||||||||||||||||||||||||||||||||||||||||||||||||||||||||||||||||||||||||||||||||||||||||||||||||||||||||||||||||||||||||||||||||||||||||||||||||||||

Not all House districts are created equally, in partisan terms. Some are designed to elect Democrats, some are designed to elect Republicans, and a comparatively small handful could go either way. When U.S. House elections roll around, as a couple of special ones did in Florida earlier this month, there is a desire to quantify districts so that people can anticipate the outcomes. Does Candidate A have any chance at all against Candidate B? How close should the race be? Could there plausibly be an upset?
On April 1, Republican Jimmy Patronis won the special election in FL-1 by a margin of 14.6%; Republican Randy Fine won the special election in FL-6 by 14.0%. [The left-wing article had the FL-6 number wrong; it should have been R+14 and not R+7. You'd think they would want to be especially accurate here, in order to make their party's "moral victory" not appear to be such a small one.] So what is all this "R+" stuff? It's nomenclature created by political analyst Charlie Cook, for the purpose of evaluating House districts; Cook claims to have published the first such data in the late 1990s. His evaluations, which are known as PVIs, are considered to be the gold standard for district ratings. When you see how they are created, you may find yourself wondering why they hold such a lofty status. From Cook's website: "The Cook Partisan Voter Index measures how partisan a district or a state is compared to the nation as a whole. A Cook PVI score of D+2, for example, means that district performed an average of two points more Democratic than the nation did as a whole, while an R+4 means the district performed four points more Republican." These ratings are not merely measures of past performance; they are also imbued with predictive value and are used to answer questions about future elections in House districts, questions such as the ones in the opening paragraph of this commentary. A slightly more detailed explanation of the calculation comes from Wikipedia: "The [PVI] looks at how every congressional district voted in the past two presidential elections combined and compares it to the national average. The Cook PVI is displayed as a letter, a plus sign, and a number, with the letter indicating the party that outperformed in the district and the number showing how many percentage points above the national average it received." We emphasized part of that last sentence because the vast majority of people who throw around PVIs are clueless about the actual meaning of the numbers, and misinterpret them entirely. This misinterpretation is not of tremendous import as long as the numbers are merely being compared to each other, which after all is their primary purpose. In the above example FL-1 is obviously a more Republican-leaning district than FL-6. Even those who are mathematically-challenged are capable of understanding that 22 is a larger number than 7 (or even 14), though they have no idea -- or the wrong idea -- of what the "22" means or how that number was calculated. 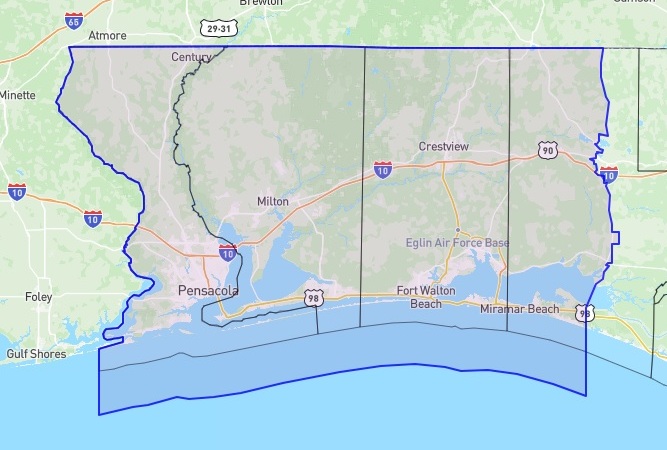
Florida congressional district 1
Let us illustrate. Both Republicans on April 1st won easily in their respective Florida special elections, however given the lean of their districts they appear to have underachieved. This enabled the media and other Democrats to claim hollow "moral" victories in the wake of Democrat defeats, because the GOP candidates did not obliterate their liberal rivals by as much as they were supposed to.

Florida congressional district 6
Randy Fine won FL-6 (PVI of R+14) by exactly 14 points, which sounds like a precisely typical result there. But R+14 does not mean the Republican should win by 14%; it means the Republican should win by 28%. So yeah, another "moral defeat" (LOL) for the GOP. Once again, this outcome is not a harbinger of future performance. In November of 2026 the GOP will win that district every bit as easily as it usually does, and Democrats will not be pissing $10 million of billionaires' money down the drain as they did a few weeks ago, no matter how easily they can afford to do so.
The Cook Political Report (CPR) has lately decided to charge a fee for up-to-date district ratings, which is a shame (for those who actually fork over cash) because their ratings are based on very limited data, and that data contains an overwhelming bias in the logical sense as opposed to the partisan sense. Anyone who has the time, the ability, and the underlying data can calculate PVIs that are not only free of charge, but which are more accurate if based on a wider range of relevant data. The Cook Political Report's current bias can be summarized as "All Republican candidates are Donald Trump". Does that sound like a good assumption to make? Democrat campaign coordinators and their media allies surely agree with Cook, but sensible folks would dispute his assertion. The CPR looks at two -- just two -- points of data for every congressional district in the country, and then anoints the districts with their sacred ratings based on that meager amount of data. The two data points are these, currently:
Astute observers will notice that the one and only Republican in this sample is Donald J. Trump. Thus, Cook is determining district ratings based solely on how much that district voted for or against President Trump. Does an affinity or a hatred for Trump all by itself determine exactly how other Republican candidates -- the ones in U.S. House races -- will fare in their specific districts? What kind of idiot would assume that it does? Below we provide the RightDataUSA.com PVI ratings, without any fee, for every U.S. House district in the country. Our ratings are likely to be similar but hardly identical to the "official" Cook PVIs (we don't know and we aren't paying to find out), because our ratings are based not only on the last two presidential elections but also on many other recent statewide elections. In the table, the "2024 Result" is the percentage which the victorious House candidate received in the November, 2024 election. 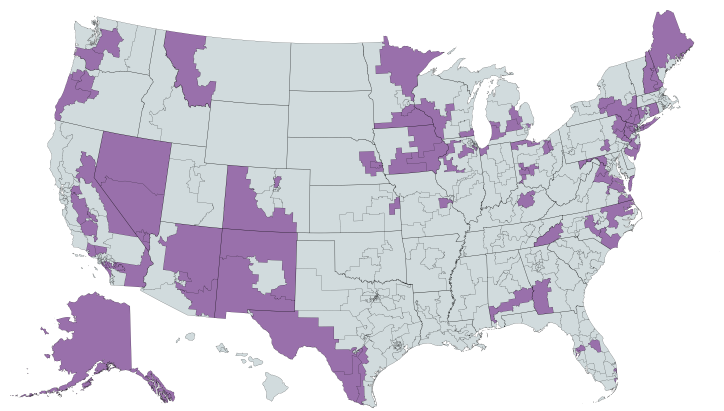
Map of 2026 battleground districts, created using mapchart.net
First, a note about the most competitive districts: Battleground districts are highlighted in the map above and in the table of all House districts which appears further down this page. It is unusual for a House member to win election in a district which tilts 6 points or more towards the opposite party although it does occasionally happen, so we define a "battleground" district as one in the range from D+5 through R+5. When upsets occur in House elections, they normally take place in these marginal districts, and therefore aren't truly "upsets".
In three cases above (CO-08, MI-07 and PA-07) the district is currently held by the "wrong" party -- the one which voters normally do not favor in statewide elections. You can bet that these three, plus other similar districts, are the ones which the national parties will have at the very top of their target lists in 2026. Those other similar districts are:
Based on the above lists, there is much more low-hanging fruit for Democrats to pick off in 2026 than there is for Republicans. Not to mention the two Republicans in already-marginal districts (Brian Steil, Derrick Van Orden) who are destined for extinction by the upcoming court-ordered Democrat gerrymander in Wisconsin. These are not the only districts which have a chance of flipping in 2026. In order to maintain control of the House, Republicans will need to hold on to a significant majority of their most vulnerable seats and perhaps achieve a small number of pickups of Democrat-held seats. They narrowly succeeded in 2024, but it will be more difficult in '26.
Update: Either we caught them on a good day or they've decided to drop the paywall for some reason, but the 2025 Cook PVI ratings are currently available even for non-subscribers! We still believe that more data means greater precision, but now readers can compare the two sets of ratings and decide for themselves. Tags:
PVI
Charlie Cook
U.S. House Ratings
More Data = More Accuracy
| |||||||||||||||||||||||||||||||||||||||||||||||||||||||||||||||||||||||||||||||||||||||||||||||||||||||||||||||||||||||||||||||||||||||||||||||||||||||||||||||||||||||||||||||||||||||||||||||||||||||||||||||||||||||||||||||||||||||||||||||||||||||||||||||||||||||||||||||||||||||||||||||||||||||||||||||||||||||||||||||||||||||||||||||||||||||||||||||||||||||||||||||||||||||||||||||||||||||||||||||||||||||||||||||||||||||||||||||||||||||||||||||||||||||||||||||||||||||||||||||||||||||||||||||||||||||||||||||||||||||||||||||||||||||||||||||||||||||||||||||||||||||||||||||||||||||||||||||||||||||||||||||||||||||||||||||||||||||||||||||||||||||||||||||||||||||||||||||||||||||||||||||||||||||||||||||||||||||||||||||||||||||||||||||||||||||||||||||||||||||||||||||||||||||||||||||||||||||||||||||||||||||||||||||||||||||||||||||||||||||||||||||||||||||||||||||||||||||||||||||||||||||||||||||||||||||||||||||||||||||||||||||||||||||||||||||||||||||||||||||||||||||||||||||||||||||||||||||||||||||
| [More commentaries] | |||||||||||||||||||||||||||||||||||||||||||||||||||||||||||||||||||||||||||||||||||||||||||||||||||||||||||||||||||||||||||||||||||||||||||||||||||||||||||||||||||||||||||||||||||||||||||||||||||||||||||||||||||||||||||||||||||||||||||||||||||||||||||||||||||||||||||||||||||||||||||||||||||||||||||||||||||||||||||||||||||||||||||||||||||||||||||||||||||||||||||||||||||||||||||||||||||||||||||||||||||||||||||||||||||||||||||||||||||||||||||||||||||||||||||||||||||||||||||||||||||||||||||||||||||||||||||||||||||||||||||||||||||||||||||||||||||||||||||||||||||||||||||||||||||||||||||||||||||||||||||||||||||||||||||||||||||||||||||||||||||||||||||||||||||||||||||||||||||||||||||||||||||||||||||||||||||||||||||||||||||||||||||||||||||||||||||||||||||||||||||||||||||||||||||||||||||||||||||||||||||||||||||||||||||||||||||||||||||||||||||||||||||||||||||||||||||||||||||||||||||||||||||||||||||||||||||||||||||||||||||||||||||||||||||||||||||||||||||||||||||||||||||||||||||||||||||||||||||||||