Recent Commentaries
| 1/16/2026: [Texas] 2026 U.S. Senate Race Update -- Jasmine Crockett and the Big Lie [RightDataUSA] | |||||||||||||||||||||||||||||||||||||||||||||||||||||||||||||||||||||||||||||||||||||||||||||||||||||||||||||||||||||||||||||||||||||||||||||||||||||||||||||||||||||||||||||||||||||||||||||||||||||||||||||||||||||||||||||||||||||||||||||||||||||||||||||||||||||||||||||||||||||||||||||||||||||||||||||||||||||||||||||||||||||||||||||||||||||||||||||||||||||||||||||||||||||||||||||||||||||||||||||||||||||||||||||||||||||||||||||||||||||||||||||||||||||||||||||||||||||||||||||||||||||||||||||||||||||||||||||||||||||||||||||||||||||||||||||||||||||||||||||||||||||||||||||||||||||||||||||||||||||||||||||||||||||||||||||||||||||||||||||||||||||||||||||||||||||||||||||||||||||||||||||||||||||||||||||||||||||||||||||||||||||||||||||||||||||||||||||||||||||||||||||||||||||||||||||||||||||||||||||||||||||||||||||||||||||||||||||||||||||||||||||||||||||||||||||||||||||||||||||||||||||||||||||||||||||||||||||||||||||||||||||||||||||||||||||||||||||||||||||||||||||||||||||||||||||||||||||||||||||||

Photo credit: slaynews.com
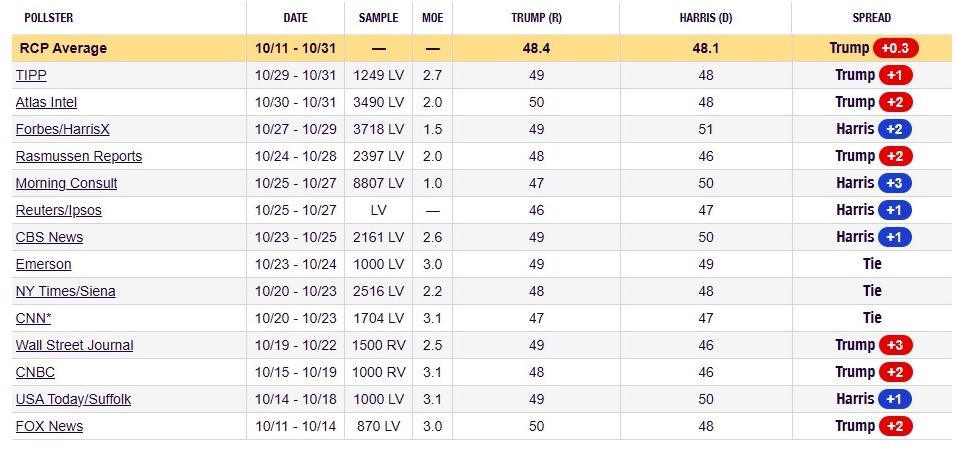
On January 15 a new poll covering the 2026 U.S. Senate election in Texas was released. That poll, taken by Emerson College, shows phony Christian state representative Holy James Talarico with a 9-point lead (47% to 38%) over unhinged racist congresswoman Jasmine Crockett among the Democrats. In the 3-way primary on the Republican side, Attorney General Ken Paxton holds a 1-point advantage (27%-26%) over incumbent squish John Cornyn, with congressman Wesley Hunt trailing at 16%. Nearly 30% remain undecided.
Crockett waited until the last possible day -- December 8 -- to announce that she was jumping into the Senate race. Prior to her momentous announcement there were two other Democrats already in the race: Talarico of course, along with 2024 loser Colin Allred. Allred pulled out just as Crockett pulled in, because the Democrats wished to avoid a crowded field that would end up requiring a runoff to resolve; Allred shifted to Texas' 33rd Congressional District for 2026, where he will face CD-32 incumbent Julie Johnson in a district which Democrats are guaranteed to win in November (D+22). Prior to the recent Republican redistricting in Texas there were three dedicated ghetto districts in the Dallas area: CD-30 (Crockett), CD-32 (Johnson) and CD-33 (Marc Veasey). Veasey is retiring after 2026. The 32nd District was significantly altered to add more rural and suburban territory (and subtract some ghetto territory), making it a solidly Republican district and causing Johnson to flee for her electoral life. Regarding these Dallas districts: somewhere along the way a deliberate lie developed, which was useful for the Crockett Senate campaign. Perhaps that lie began here, in a typically breathless article from the Gateway Pundit, where everything is always Breaking! Bombshell! Pow! Zap! (Just like the old Batman TV series!). 
The article linked above is from January 6 and pertains to the new GOP-friendly redistricting plan in Texas which was upheld by the U.S. Supreme Court a month earlier. The effects of that plan were well-known long before January (or even December) but the folks at Gateway Pundit apparently didn't bother to examine the plan at all. Instead, they posted the following falsehood; the big lie is highlighted:
The only morsel of truth in that quote concerns Democrat Al Green, who is as much of an unhinged racist as Crockett. Green's district, CD-9, actually was "dismantled" and will be easily won by Republicans this fall. Green will survive, however. He is bouncing over to CD-18, which is the ghetto-est district in the Houston area. That district has had no incumbent since Sylvester Turner (D) died in 2025, but it will get one in two weeks when a special election is held. Regardless of which newcomer wins in January, Green will still retain an enormous advantage heading into the March primary in CD-18. CD-9 is gone as far as Democrat chances of victory are concerned, but the indisputable fact is that CD-30 -- Crockett's current district -- not only was not "effectively dismantled" in the new 2026 map, it is practically identical, both geographically and politically, to what it was in 2022 and 2024. The big lie is designed to inspire Crockett's hate-filled minions, and give the utterly false impression that Texas Republicans fear this moonbat to such an enormous extent that they would obliterate her district and leave her politically homeless. "But she'll outsmart them, all right! Our hero will turn Texas' new racist Republican gerrymander to her advantage, leave the House and march right over to the Senate! Then they'll be sorry they ever messed with her!" Click here: Texas Congressional District 30 Demographics, Election Results and History CD-30 was first created in 1992, specifically to elect state Senator Eddie Bernice Johnson -- who just happened to be the chairman of the state's redistricting committee that year. The inaugural version of CD-30 was only 30% White, the district being deliberately designed to elect a black Democrat such as Johnson. The White percentage has decreased steadily with subsequent redistrictings. Johnson was elected to 15 terms in Congress, from that same district (with occasional subtle alterations) which has always covered much of central Dallas and the southern portion of Dallas County. As of 2022, the district was 18% White, 40% black and 36% Hispanic. Johnson often received 80% or more of the vote and even broke 90% three times in her perfectly safe (politically, that is) district. Johnson retired in 2022. Crockett, whose main qualifications for federal office are that she once claimed to be the victim of a "hate crime", and she was one of the "Chicken D's" (2021 version) in the Texas legislature who fled the state in order to thwart Republican efforts to pass a bill which would bolster the integrity of elections in Texas and make Democrat vote fraud more difficult. The flight of the Chicken D's landed in Washington, D.C., amidst significant media adulation. Nobody ran faster at that time to get in front of the TV cameras than Jasmine Crockett, and she has been a master of self-publicity and a media darling ever since. 
Texas CD-30, as configured in 2024
When Johnson retired from Congress, Crockett lined up with 8 other Democrats to see who would be selected to replace the elderly incumbent. Although former congressional staffer Jane Hamilton had much of the establishment support, Crockett won the primary easily and almost avoided a runoff. She won the 2022 general election without breaking a sweat, and then had no serious opposition of any kind -- Democrat or Republican -- in 2024. Despite being in only her second term in Congress, some may assume (based on the enormous amount of attention and adoration she receives from the liberal media) that Crockett is among the Democrat party leadership in the House, but she is not. She's simply a back-bencher with a voting record that is just about 100% liberal.
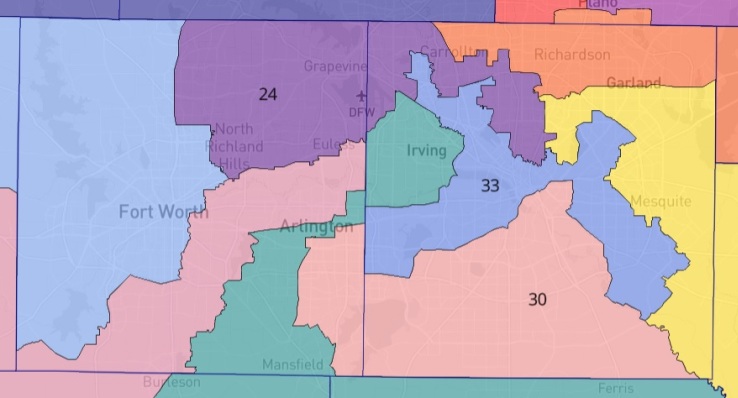
Metroplex-area congressional districts (including CD-30), as configured for 2026 Source: Dave's Redstricting
The version of CD-30 in which Crockett has won twice is rated by Charlie Cook as D+25. We call it D+27. In either case, it's well within "landslide Democrat" territory, just as it was during the (Eddie Bernice) Johnson Administration. Because Republican redistricters sought to flip CD-32 from D to R -- which they did; formerly D+14, now R+6 -- they increased the number of Democrats in adjacent districts such as CD-30 and CD-33. If Crockett had decided to remain in CD-30, she would have been running in a D+28 district and no other Democrat would have dared oppose her in the primary.
Tags:
2026
Texas
Senate
Crockett's big lie
| |||||||||||||||||||||||||||||||||||||||||||||||||||||||||||||||||||||||||||||||||||||||||||||||||||||||||||||||||||||||||||||||||||||||||||||||||||||||||||||||||||||||||||||||||||||||||||||||||||||||||||||||||||||||||||||||||||||||||||||||||||||||||||||||||||||||||||||||||||||||||||||||||||||||||||||||||||||||||||||||||||||||||||||||||||||||||||||||||||||||||||||||||||||||||||||||||||||||||||||||||||||||||||||||||||||||||||||||||||||||||||||||||||||||||||||||||||||||||||||||||||||||||||||||||||||||||||||||||||||||||||||||||||||||||||||||||||||||||||||||||||||||||||||||||||||||||||||||||||||||||||||||||||||||||||||||||||||||||||||||||||||||||||||||||||||||||||||||||||||||||||||||||||||||||||||||||||||||||||||||||||||||||||||||||||||||||||||||||||||||||||||||||||||||||||||||||||||||||||||||||||||||||||||||||||||||||||||||||||||||||||||||||||||||||||||||||||||||||||||||||||||||||||||||||||||||||||||||||||||||||||||||||||||||||||||||||||||||||||||||||||||||||||||||||||||||||||||||||||||||
| 12/15/2025: Indianalysis [RightDataUSA] | |||||||||||||||||||||||||||||||||||||||||||||||||||||||||||||||||||||||||||||||||||||||||||||||||||||||||||||||||||||||||||||||||||||||||||||||||||||||||||||||||||||||||||||||||||||||||||||||||||||||||||||||||||||||||||||||||||||||||||||||||||||||||||||||||||||||||||||||||||||||||||||||||||||||||||||||||||||||||||||||||||||||||||||||||||||||||||||||||||||||||||||||||||||||||||||||||||||||||||||||||||||||||||||||||||||||||||||||||||||||||||||||||||||||||||||||||||||||||||||||||||||||||||||||||||||||||||||||||||||||||||||||||||||||||||||||||||||||||||||||||||||||||||||||||||||||||||||||||||||||||||||||||||||||||||||||||||||||||||||||||||||||||||||||||||||||||||||||||||||||||||||||||||||||||||||||||||||||||||||||||||||||||||||||||||||||||||||||||||||||||||||||||||||||||||||||||||||||||||||||||||||||||||||||||||||||||||||||||||||||||||||||||||||||||||||||||||||||||||||||||||||||||||||||||||||||||||||||||||||||||||||||||||||||||||||||||||||||||||||||||||||||||||||||||||||||||||||||||||||||
On October 27, one week before the state of California was inevitably going to approve its most recent Democrat gerrymander (it passed by 3,000,000 votes and will cost Republicans 4 or 5 House seats), Indiana Governor Mike Braun called for a special session of his state's legislature in order to retaliate against California to some degree. There's only so much that a relatively small state such as Indiana can do against a behemoth like California, but Braun and Indiana conservatives -- encouraged by President Donald Trump -- prepared to revise the Hoosier State's congressional district map in such a way as to enable Republicans to go from a 7-2 advantage in the Indiana delegation to possibly as much as a 9-0 sweep in a good election year.
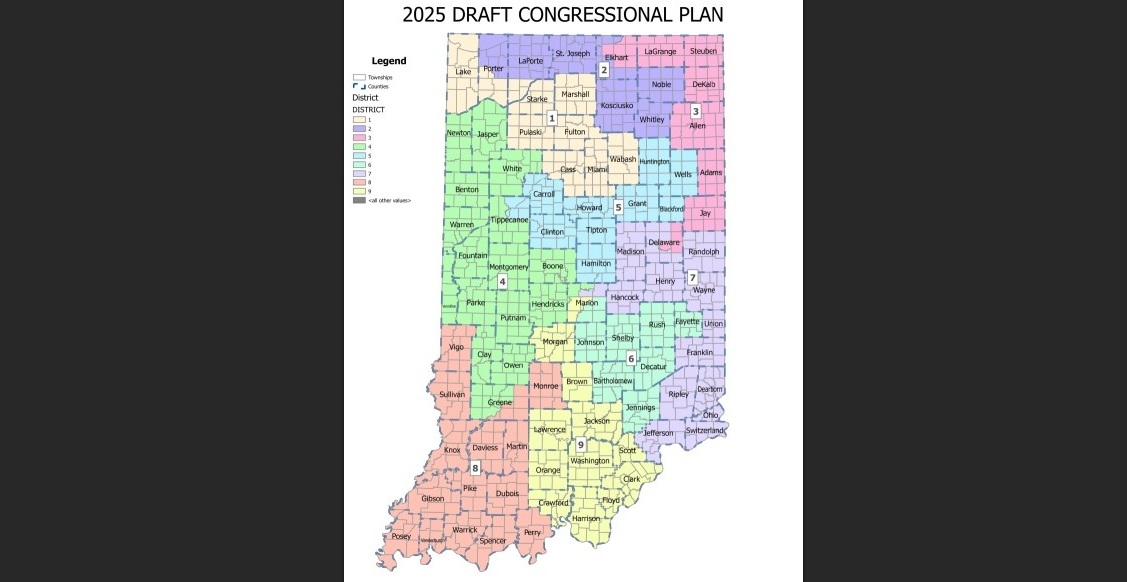
Background: Republicans already hold 7 of Indiana's 9 U.S. House seats, and have been in control by that exact margin since the 2012 election. The two districts which they perennially do not hold are CD-1 in the northwestern part of the state, and CD-7 which is most of the city of Indianapolis. The purpose of the new map was to alter these two districts sufficiently to favor Republican candidates in 2026, and to do so without endangering Republican incumbents in the other 7 districts. That is what California Democrats accomplished with their new gerrymander which eliminates 4 or 5 House Republicans while simultaneously protecting half a dozen Democrats who could be vulnerable to a minor "red" wave. Indiana Congressional District 1 (CD-1): 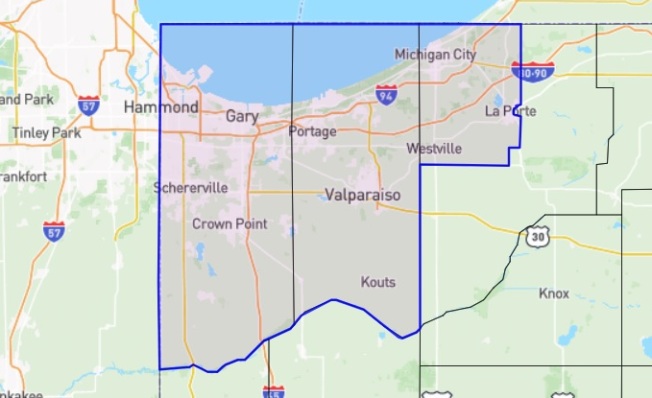
Indiana Congressional District 1
CD-1 has been in Democrat hands for almost 100 years without interruption; no Republican has ever won a House race there since the district was created in 1932. At that time Lake County (Gary, Hammond) was given its own congressional district, the rapidly growing county having gone from 38,000 residents in 1900 to a population of 261,000 by 1930. Since then, CD-1 has always contained most or all of Lake County, but in recent years Porter County and parts of LaPorte County have been added. Lake County has been losing population since the late 1960's, when Whites began fleeing in droves -- leaving behind a county and congressional district which thus became even more Democrat-oriented.
CD-1 has become much more competitive recently, and the GOP realizes that even a fairly small shift to the right could result in an unprecedented House win there; the new map for 2026 was going to implement that small shift to the right. In 2020, frequent (and hopeless) Republican candidate Mark Leyva received slightly over 40% of the House vote against Democrat Frank Mrvan. Donald Trump did even better than Leyva in CD-1 that year, taking a shade under 45%. That may not sound impressive, but it represented a vast improvement in GOP fortunes in northwestern Indiana. In 2022 Republicans took a serious shot at unseating Mrvan by nominating (and funding) Jennifer-Ruth Green, an Air Force veteran and commercial pilot. Green claimed to be a conservative but foolishly distanced herself from Donald Trump and took liberal positions on some issues; she lost by about 5 points. In 2024 Mrvan was opposed by state Senator Randy Niemeyer, a moderate/establishment Republican. But this time the GOP was not interested in wasting millions of dollars that it couldn't afford, and the party did not support Niemeyer as well as it had Green. Niemeyer lost by 8.5% -- which is still much better than Republicans had historically done in CD-1. Trump in 2024 lost by less than 1% against Kamala Harris in CD-1, a margin of barely 1,000 votes out of 327,000. Mrvan knows that his House seat is not perfectly safe by any means. He had been running a little scared in 2025, but can breathe easier now that Indiana Senate RINOs have protected him. The district is rated by Charlie Cook as being D+1, but others who rate districts based on a larger dataset have it more like D+4. The proposed district map for 2026 would have made it R+1 according to the limited (and possibly specious) data which is available. In a good Republican year (in other words, probably not 2026), Republicans would have a decent chance of picking up this House seat even under the current boundaries of the district. Had the new map been passed, they would not have required quite as much of a "good" year to snatch CD-1 from the Democrats for the first time ever. Indiana Congressional District 7 (CD-7): 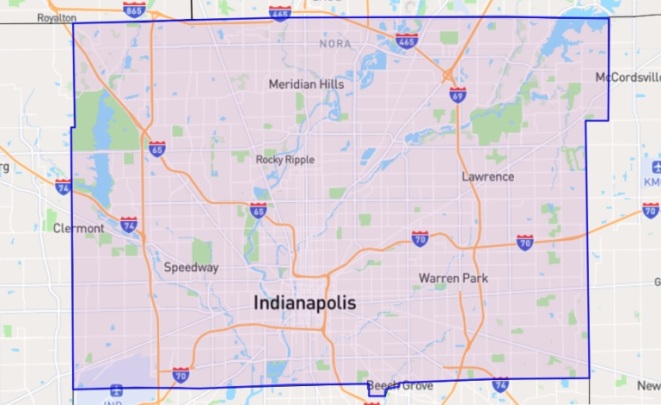
Indiana Congressional District 7
This district, which was the old CD-10 until Indiana was reduced to 9 districts in 2002, was only slightly D-leaning in the 1990s. Republicans made a concerted effort in 1996 when Andy Jacobs retired. Jacobs, a Democrat who was first elected in 1964, was known for spending practically zilch on his campaigns yet he still prevailed time after time; Democrats had to spend nearly $600K to hold the seat in '96.
2025 Redistricting Attempt: As mentioned above, the new map which would have resulted in a minimum of +1 House seat for Republicans was rejected by the Indiana state Senate by a vote of 19-31. Twenty-one RINOs joined all 10 Democrats in saving one or perhaps two Democrat seats in Congress. Here is some more information about the 21 traitors, 10 of whom are up for re-election in 2026; the other 11 will not have to face the voters again until 2028.
Probably not coincidentally, the vast majority of the GOP quislings occupy Senate seats which are in the vicinity of the two U.S. House districts that could have flipped from D to R had these quislings' votes not put an end to that possibility. Of the 21, only two (Dernulc, K. Walker) represent Senate districts which could be described as marginal in a normal election year; the other 19 are varying degrees of safe for the GOP nominee.
Despite all that, the 21 virtuous cowards are being generally defiant about their surrender. As is customary with RINOs, they cower like whipped pups in the face of the media and other Democrats, and save what little courage they possess to use only when opposing true conservatives in their own party. On December 11 several of them raced to the media to issue statements defending their backstabbing of Republicans nationwide:
"Thousands". "Overwhelmingly". Sure. Several of these folks are going to hear from thousands of voters in next year's primary election, and will hopefully be overwhelmingly rebuked at the polls. Bray, Doriot and Leising are exempt, what with not being up for re-election until 2028; Bray may still receive some punishment after 2026 -- he may find himself as "Minority Leader" or find that his majority is greatly reduced. Some Twitter account posted this on the day of the Indiana vote:
Yes it's just an unproven conspiracy theory, but it fits with the general idiocy of the Stupid Party. Not only did Indiana Republicans surrender when they were winning, but it figures they would do so under terms which are totally unfavorable -- allowing Democrats to retain two seats in the Hoosier State while maybe retaining one GOP seat in Maryland. 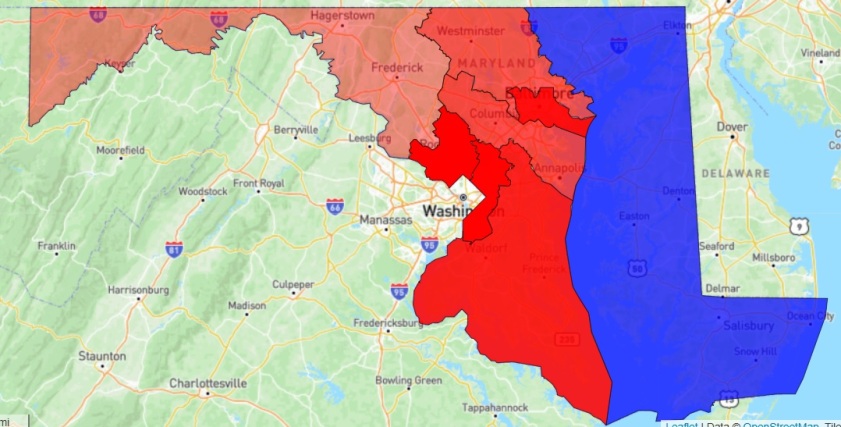
Maryland 2024 House results: 1 R, 7 D
The Democrat president of the Maryland state Senate had already announced that gerrymandering would not be on the agenda during the special session which has been called for mid-December, despite pressure from Maryland Governor Barack Obama 2.0 (a clean and articulate empty suit, who for years has been carefully groomed in preparation for achieving high political office). Additionally, a Democrat gerrymandering expert has warned that an attempt to create an 8-0 sweep of the Maryland congressional delegation would likely not withstand a court challenge, assuming the sleepy, complacent GOP would choose to file a challenge.
Gerrymandering War scorecard: Here is how things currently stand: 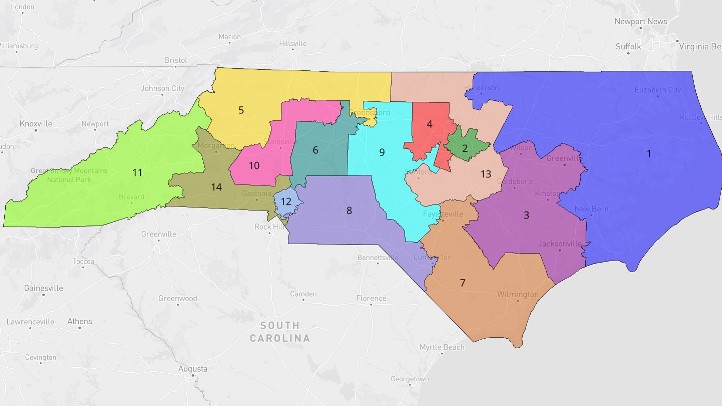
Map source: Dave's Redistricting
In North Carolina, a panel of federal judges dismissed Democrat claims of "racism" and refused to order the injunction which the professional racists sought. This presumably means that the new congressional district map drawn by the Republican legislature will be used for the 2026 midterms. Republicans currently hold a 10-4 advantage in the North Carolina delegation, the new map makes only minor changes, and those changes primarily affect only two districts (CD-1 and CD-3). CD-1, which is held at this time by Democrat Don Davis, is being changed from a PVI of D+1 to perhaps R+3. This could be enough to dislodge Davis, assuming 2026 isn't a "blue" wave of any kind. The adjacent CD-3 moves from R+8 to R+3. As we have noted many times, most of the 10 GOP-held districts are marginal to some degree, and in a bad election year we could see a real bloodbath in the Tarheel State. Having an uninspiring simp like Michael Whatley lose big to Roy Cooper in the Senate race is not going to help matters down the ballot.
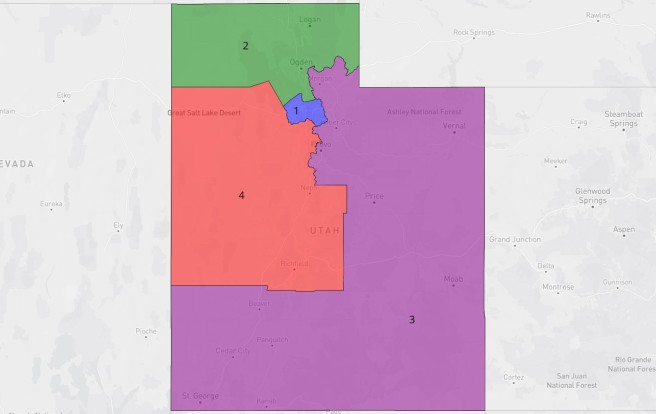
Map source: Dave's Redistricting
In extremely Republican Utah, a RINO judge has sided with Democrats and is forcing the state to discard the district map which was used in 2022 and 2024 (which resulted in the GOP winning all 4 House seats). Initially, she was expected to select a new map which would have two super-safe Republican districts and two iffy ones, both of which tilted a little to the right. Instead she chose a map which would guarantee one Democrat pickup. Therefore, at best, the supposed GOP win in North Carolina is negated by the certain loss in Utah.

Map source: Dave's Redistricting
On December 4, the U.S. Supreme Court in a 6-3 decision granted an "emergency stay" which allows the new Republican-drawn map in Texas to be used in 2026 while Democrat lawsuits continue indefinitely. As a result of the stay, Republicans expect to pick up as many as 5 U.S. House seats which are currently held by Democrats. The affected districts are:
Map source: Dave's Redistricting
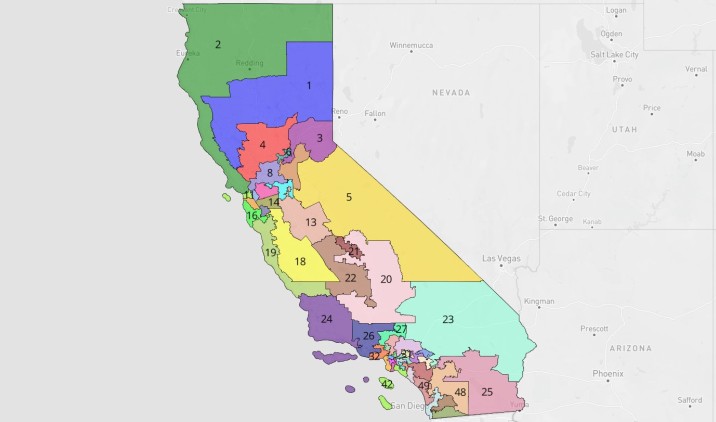
California voters in November passed Proposition 50, which allows the state to proceed with its hyper-partisan gerrymander which is designed to eliminate 5 Republicans from the California delegation in the U.S. House. Using the same tactic which Democrats have relied on (with much success) over the past 30+ years, the U.S. Department of Justice has joined California Republicans who are suing California on the basis that the new map mandates racially-gerrymandered districts, which is illegal. The motion to intervene is still pending before a U.S. District Court in California. Don't hold your breath in anticipation of any relief here. The case was scheduled to be heard on December 15. Another Republican lawsuit has already been dismissed for the good, old "lack of standing" reason that liberal judges often use against Republicans who have a good case (remember 2020?).
Map source: Dave's Redistricting
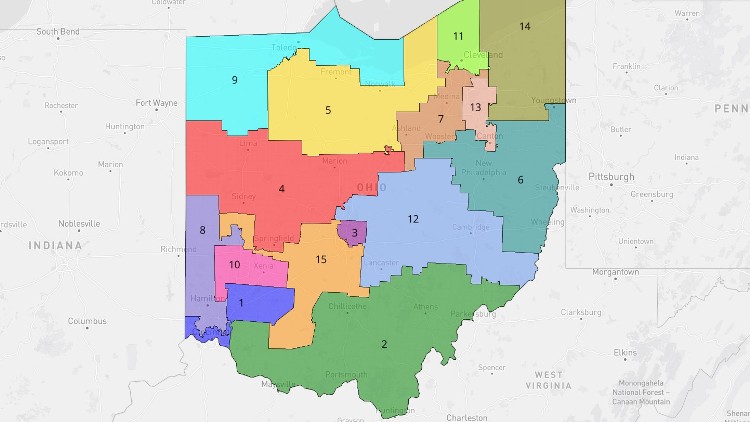
There will be a new congressional district map in Ohio for 2026, but it is not substantially different from the map which was used in 2022 and 2024. A revised map was required by state law because the previous one was passed without bipartisan support and was therefore only permitted to be used twice. The 2026 map does have bipartisan support, which ought to tell you something about how effective it will be for Republicans in 2026 and beyond. The GOP currently holds 10 of the 15 U.S. House seats in Ohio, but three Democrat-held districts (CD-1, CD-9, CD-13) are shaky at best. Yet Republicans failed to capture any of the three in 2022 or 2024. They will give it another try in 2026 under district boundaries which have received only subtle alterations from those which existed in the past two elections. CD-1 and CD-9 are moved imperceptibly to the right, while CD-13 goes the opposite direction in a similarly negligible way. There are some shaky GOP-held districts too, so if 2026 goes sour there could be a few House results in Ohio which would surprise the unaware. 
Map source: Dave's Redistricting
The redistricting effects of Texas (R) and California (D) will cancel each other out, or come close to doing so; North Carolina (R) and Utah (D) also may be a net-zero. Ohio will likely end up with a 10-5 GOP advantage, no change from the current situation. Missouri's revised 5th Congressional District is going to be about R+8, an easy GOP pickup from the existing Democrat in CD-5. That makes the current aggregate redistricting score probably +1 for the GOP in 2026, with some variation depending on the overall demeanor of the election. If there is some "blue" wave, which should be greatly expected as things stand now, then any minor redistricting advantage accruing to the Republicans would be swamped by a general swing to the left overall.
Tags:
Indiana
U.S. House
Surrender RINOs
| |||||||||||||||||||||||||||||||||||||||||||||||||||||||||||||||||||||||||||||||||||||||||||||||||||||||||||||||||||||||||||||||||||||||||||||||||||||||||||||||||||||||||||||||||||||||||||||||||||||||||||||||||||||||||||||||||||||||||||||||||||||||||||||||||||||||||||||||||||||||||||||||||||||||||||||||||||||||||||||||||||||||||||||||||||||||||||||||||||||||||||||||||||||||||||||||||||||||||||||||||||||||||||||||||||||||||||||||||||||||||||||||||||||||||||||||||||||||||||||||||||||||||||||||||||||||||||||||||||||||||||||||||||||||||||||||||||||||||||||||||||||||||||||||||||||||||||||||||||||||||||||||||||||||||||||||||||||||||||||||||||||||||||||||||||||||||||||||||||||||||||||||||||||||||||||||||||||||||||||||||||||||||||||||||||||||||||||||||||||||||||||||||||||||||||||||||||||||||||||||||||||||||||||||||||||||||||||||||||||||||||||||||||||||||||||||||||||||||||||||||||||||||||||||||||||||||||||||||||||||||||||||||||||||||||||||||||||||||||||||||||||||||||||||||||||||||||||||||||||||
| 12/3/2025: Tennessee Special Election: Post-Mortem [RightDataUSA] | |||||||||||||||||||||||||||||||||||||||||||||||||||||||||||||||||||||||||||||||||||||||||||||||||||||||||||||||||||||||||||||||||||||||||||||||||||||||||||||||||||||||||||||||||||||||||||||||||||||||||||||||||||||||||||||||||||||||||||||||||||||||||||||||||||||||||||||||||||||||||||||||||||||||||||||||||||||||||||||||||||||||||||||||||||||||||||||||||||||||||||||||||||||||||||||||||||||||||||||||||||||||||||||||||||||||||||||||||||||||||||||||||||||||||||||||||||||||||||||||||||||||||||||||||||||||||||||||||||||||||||||||||||||||||||||||||||||||||||||||||||||||||||||||||||||||||||||||||||||||||||||||||||||||||||||||||||||||||||||||||||||||||||||||||||||||||||||||||||||||||||||||||||||||||||||||||||||||||||||||||||||||||||||||||||||||||||||||||||||||||||||||||||||||||||||||||||||||||||||||||||||||||||||||||||||||||||||||||||||||||||||||||||||||||||||||||||||||||||||||||||||||||||||||||||||||||||||||||||||||||||||||||||||||||||||||||||||||||||||||||||||||||||||||||||||||||||||||||||||||

Democrats were counting on Santa coming early to Tennessee this year.

Photo credit: Tennessee Star
Van Epps' win was quite an important result, given the narrow GOP margin in the House, and the amount by which he triumphed is not nearly as important though it will be the subject of rigorous analysis in the media for the next few days before being forgotten.
We have already highlighted much of the Tennessee Democrat's nutzoid viewpoints here, but of course few if any of those things were featured in Aftyn Behn's campaign ads. Instead, those ads focused on the economy, health care, and of course hating on Donald Trump and Republicans. Behn campaigned as a populist rather than as the woke lunatic she really is. She didn't fool quite enough voters, but she did make a dent in the customary Republican MOV in TN-7. DNC chair Ken Martin called Behn's performance "historic", and "a flashing warning sign for Republicans heading into the midterms". Behn hinted that she may run again for Congress in 2026 (please do!), but Democrats are probably not quite so stupid as to allow that. Will anyone admit she was a bad candidate, or at least that she was just an experiment to see how a complete left-wingnut would fare in a low-turnout special election in a supposedly "deep red" district? Will they really stick to this approach going forward? A Democrat who is less radical than Behn would undoubtedly have fared better on Tuesday. In the end, what we have here is yet another "moral victory" for Democrats to go with the actual victory for Republicans. The same thing happened 8 months ago in a couple of special elections in Florida, with Republicans winning and retaining those seats -- but they won by only half as much as they were "supposed" to. Democrats spent an inordinate amount of money trying to purchase an actual "solid red" district (FL-6), but they failed miserably there too. Because Republican Randy Fine won that election by only 14 points instead of 28 points in the R+14 district, Democrats were outwardly cheerful then too despite losing by over 25,000 votes. Today's talking points regarding this tremendous Democrat victory (LOL) on Tuesday:
There is at least one kernel of truth contained within all the spinning, and that is point number two. For example, the recent re-map in North Carolina may help pick up one (1) seat for the GOP in 2026, however at least half a dozen Republican incumbents are endangered in the Tarheel State; the Republicans are still favored in their respective districts but in a "blue" wave a lot of them could drown. Meanwhile in California, the recently-approved Democrat gerrymander not only eliminates 4 or 5 GOP House seats, but also protects half a dozen Democrat incumbents who may have been vulnerable without the new map. When Republicans get into a gerrymandering war with the experts at such things -- Democrats -- they may find themselves outclassed even if the courts actually permit the new GOP maps to be used. 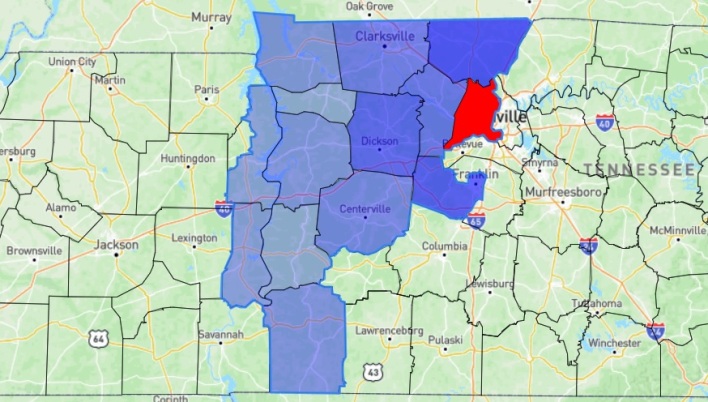
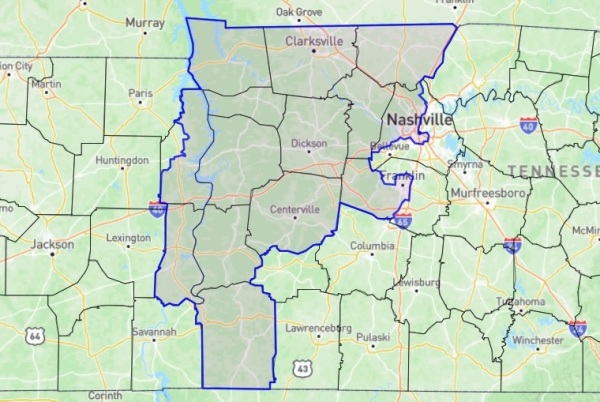
TN-7 results: December, 2025 special election
Election report card:
Montgomery County was disappointing for Van Epps, but the ones other than Nashville saved him. We said, regarding the 2024 House election: "In the other 12 counties combined, Green took over 72%. Van Epps had better get 65% or more, even if he can't quite muster 72%". He got 68.7% in the 12 counties outside of Davidson & MontCo. Generally, the farther away a county is from Nashville, the less it swung to the left on Tuesday (Robertson being an exception; it is adjacent to Nashville but did relatively well for Van Epps anyway). We asked: "Does 54.3% of the 2025 primary vote going to the GOP mean anything for the general election? If so, it probably just sets an upper limit for Van Epps". He took 53.9% as it stands now, very close to that theoretical limit. The relative party vote shares in primary elections in House races rarely forecast general elections with such precision as we saw in TN-7 in both 2024 and 2025. Turnout was certainly a factor, with the early/absentee ballots (which always favor the left) being insufficient to get the Democrat over the hump. We said: "Even with visions of 2018 dancing in Democrat heads, it's possible that turnout next week will not reach that 2022 number (181,000). . . and low pre-election day turnout here -- if it stays low -- may actually favor Republicans". Turnout in 2025 was 180,000 with still a tiny number of votes possibly remaining to be counted. Rats needed a repeat of 2018 as far as motivation was concerned; instead they got a repeat of 2022. That wasn't bad at all for a special election, but not nearly enough to tip the scales. We also predicted a Van Epps win "by 2 or 3 points". His MOV was 8.9% and that, under the circumstances, is a significant accomplishment even if it's not anywhere close to the 16% GOP lean of the district. Democrat money, motivation and organization had a big impact (as they always do in low-turnout special elections), but those things didn't make a big enough impact because Republican voter turnout on Election Day dwarfed that of the Democrats'. As we have noted above, the outcome in TN-7 was quite similar to the special election in FL-6 in April -- with the GOP winning, but only by half the normal amount. As in FL-6, although they invested heavily in the special election and claimed a moral victory, Democrats will not be spending quite so outrageously in 2026 in solid "red" districts, so Van Epps should be safe in TN-7 (except perhaps in a primary) from this point through at least 2030. One final word about this district: of the 435 House districts nationwide there are 212 which lean R; 5 are rated even; and 218 lean D, not factoring in any of the 2025 redistrictings yet. TN-7 is rated as R+8, which ranks it only as the 139th most Republican district in the country (tied with 12 others). Even if you accept Charlie Cook's rating of R+10 instead of our R+8, that would rank TN-7 121st at best. In either case, that's a curious definition of "dark red". It's just ordinary red, that's all. But the media and other Democrats are obliged to make it sound to their unenlightened followers as if the greatest upset in election history almost occurred here. Tags:
2025
Tennessee
Special election
Merry Christmas!
| |||||||||||||||||||||||||||||||||||||||||||||||||||||||||||||||||||||||||||||||||||||||||||||||||||||||||||||||||||||||||||||||||||||||||||||||||||||||||||||||||||||||||||||||||||||||||||||||||||||||||||||||||||||||||||||||||||||||||||||||||||||||||||||||||||||||||||||||||||||||||||||||||||||||||||||||||||||||||||||||||||||||||||||||||||||||||||||||||||||||||||||||||||||||||||||||||||||||||||||||||||||||||||||||||||||||||||||||||||||||||||||||||||||||||||||||||||||||||||||||||||||||||||||||||||||||||||||||||||||||||||||||||||||||||||||||||||||||||||||||||||||||||||||||||||||||||||||||||||||||||||||||||||||||||||||||||||||||||||||||||||||||||||||||||||||||||||||||||||||||||||||||||||||||||||||||||||||||||||||||||||||||||||||||||||||||||||||||||||||||||||||||||||||||||||||||||||||||||||||||||||||||||||||||||||||||||||||||||||||||||||||||||||||||||||||||||||||||||||||||||||||||||||||||||||||||||||||||||||||||||||||||||||||||||||||||||||||||||||||||||||||||||||||||||||||||||||||||||||||||
| 11/27/2025: Tennessee Special Election: Do Republicans Need Another Wake-up Call Already? [RightDataUSA] | |||||||||||||||||||||||||||||||||||||||||||||||||||||||||||||||||||||||||||||||||||||||||||||||||||||||||||||||||||||||||||||||||||||||||||||||||||||||||||||||||||||||||||||||||||||||||||||||||||||||||||||||||||||||||||||||||||||||||||||||||||||||||||||||||||||||||||||||||||||||||||||||||||||||||||||||||||||||||||||||||||||||||||||||||||||||||||||||||||||||||||||||||||||||||||||||||||||||||||||||||||||||||||||||||||||||||||||||||||||||||||||||||||||||||||||||||||||||||||||||||||||||||||||||||||||||||||||||||||||||||||||||||||||||||||||||||||||||||||||||||||||||||||||||||||||||||||||||||||||||||||||||||||||||||||||||||||||||||||||||||||||||||||||||||||||||||||||||||||||||||||||||||||||||||||||||||||||||||||||||||||||||||||||||||||||||||||||||||||||||||||||||||||||||||||||||||||||||||||||||||||||||||||||||||||||||||||||||||||||||||||||||||||||||||||||||||||||||||||||||||||||||||||||||||||||||||||||||||||||||||||||||||||||||||||||||||||||||||||||||||||||||||||||||||||||||||||||||||||||||

Photo credit: The Tennessee Conservative
On December 2 there will be a special election in Tennessee's 7th Congressional District to fill the vacancy which was caused when Republican Mark Green resigned from the House in July to "take a job in the private sector". The GOP currently controls the House by the count of 219-213. There are two vacant Democrat seats (TX-18, NJ-11) which will be easily retained by other Democrats when the special elections for those seats roll around next year. The outcome of this Tennessee election next week will determine whether the Republican advantage is eventually 5 seats (220-215) or 3 seats (219-216).
Current map of Tennessee congressional district 7
In 2021 Tennessee Republican redistricters did something that their colleagues in other states were too chicken to do. They broke up a Democrat district (CD-5) which caused Republicans to pick up one House seat as of 2022. CD-5 formerly contained all of the city of Nashville, and therefore was heavily Democrat. But for 2022 and beyond the city was split into three pieces, and those pieces were attached to heavily Republican suburban and rural territory. CD-5 incumbent Democrat Jim Cooper saw what he would be up against in 2022, and opted to retire.
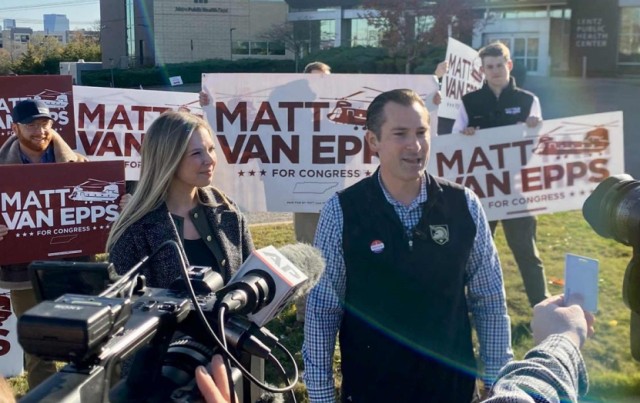
Photo credit: Nashville Tennesseean
GOP nominee Matt Van Epps is a West Point graduate, U.S. Army veteran and current member of the Tennessee Army National Guard. He is a former official in the administration of Tennessee Governor Bill Lee, most recently as director of the state's Department of General Services. Van Epps previously served as Lee's "COVID Czar", which is not exactly a resume-enhancer. Van Epps, like Lee, is considered by many to be a member in good standing of the squishy GOP establishment. There was an 11-way Republican primary in October, which was decisively won by Van Epps after he received the endorsement of President Trump, much to the dismay of conservatives.

Photo credit: Tennessee Star
His opponent, radical leftist Aftyn Behn, could hardly provide a more stark contrast.
Any one of the above would make a great campaign ad for Republicans. But are they on the air with any of this? Or are they just making a few posts on Twitter? Polling and other data: A new Emerson poll as of 11/26 shows Van Epps up but a very close race. Why should we trust anything Emerson says? Look at their forecast of the New Jersey Governor election -- they had the Republican losing by just 1 point. Just because they were delighted to be wrong about the extent of Jack Ciattarelli's defeat, doesn't make them any less wrong. Some observers have noticed what appears to be an oddity in the internal breakdowns of yesterday's Emerson poll. Trump won Tennessee's 7th Congressional District with 60.4% of the vote in 2024. Yet Emerson has only 53.6% of their polling sample as being Trump voters. We concede that turnout and motivation are much different now than they were in 2024; to slightly modify a common phrase which is popular among losers: "12 months ago is an eternity in politics". But have things really moved 7 points to the left in CD-7? Haven't we been assured by the GOP establishment and other deniers of reality that everything bad which happened three weeks ago was confined to "blue" states only? So it can't happen here -- or can it? As far as financial data, the latest FEC reports on this election are from two weeks ago. At that time the Democrat had raised about 25% more money than the Republican (what else is new?) but had spent slightly less. Even based on those somewhat out-of-date figures, Behn had about $300,000 more cash-on-hand than Van Epps did, heading into the final 3 weeks of the campaign. You can be reasonably certain that in those final 3 weeks, the Democrats have raked in, and will spend, far more than the Republican. That fact will be apparent when the final FEC reports become available. 
Photo credit: Drill Down with Peter Schweitzer
Nearly all of the $1.2 million which Behn has raised allegedly comes from "individual" contributors. The Democrats' ActBlue Laundromat routinely splits billionaire donations into tiny fragments and assigns those fragments to unaware individuals in a process known as "smurfing". This creates the illusion of broad "mom-'n-pop" support (not to mention evading campaign finance laws) and allows the Democrat to declare with a straight face that she is a candidate "of the little people". Van Epps, on the other hand, must rely on actual individual contributions, and those have been insufficient to be competitive in a high-stakes race like this one. To bridge the fundraising gap, the Republican has had to take a substantial amount (about 30% of his receipts) from PACs.
In 2024 Mark Green won 13 of the 7th District's 14 counties, losing Davidson County (Nashville) by 26,000 votes but winning overall by 69,000 votes. Nashville gets all of the hype in the district but cast only 22.3% of the vote in 2024. The city will give Behn a substantial majority next Tuesday; Nashville voters hate Republicans more than the Democrat nominee hates Nashville. It's a complex relationship, LOL. Montgomery County, with 24.1% of the vote, is the top vote-producer in the district and carries a little more weight than Nashville. Green won Montgomery by 19.7% in 2024; Van Epps will not approach that number. In the other 12 counties combined, Green took over 72%. Van Epps had better get 65% or more, even if he can't quite muster 72%. So how do all those figures from just 12 months ago suddenly translate into a very close race now? They shouldn't. Green's performance last year was not an anomaly: even though the Democrats fielded a candidate who was a felon (but a cute one!), you can't say they didn't try to win in 2024; they spent $1.25 million, more than they spent in the other two Nashville-area districts combined. Even though Republican Andy Ogles in CD-5 was declared by the media to be vulnerable, the Democrats mostly bypassed Ogles and focused more resources on opposing Mark Green instead. Ogles won by nearly 20% in CD-5, almost the same MOV that Green attained in CD-7. Primary data: There were 53,483 total votes in the 2024 House primaries in CD-7, 59.6% of which went to the unopposed GOP candidate. Green then got 59.5% in the general (some little-known independent took 2.4%). It was just a coincidence that the primary vote share was so close to Green's general election percentage, but not a complete coincidence. There were 67,886 total votes in the 2025 special election primaries, 54.3% of which went to Republicans. Democrats are seizing upon this data point, claiming it is an indicator of a substantial shift in their direction. However, the fragmented Rat primary and Behn's lack of endorsement by the primary losers could indicate an upcoming underperformance for her in December. It's a nice thought, but don't bank on it happening. The Republican primary was just as split as the Democrats', and the wounds inflicted there have not healed. On the Democrat side, money makes up for a lot of hurt feelings. Does 54.3% of the 2025 primary vote going to the GOP mean anything for the general election? If so, it probably just sets an upper limit for Van Epps. There will be 4 independent candidates on the ballot, one of which is a former Republican. Altogether they will take 2 or 3 percent of the vote at most. Conclusion: All pertinent factors indicate a close race (within 5 points one way or the other). No factors indicate an easy GOP win. The factor which favors the Republicans to the greatest degree is the most irrelevant one of them all -- the PVI. PVIs are created based on regularly-scheduled elections with high turnout, and 2025 is not going to be one of those. There were 323,000 votes cast in CD-7 in the presidential year of 2024; turnout was 181,000 in midterm 2022, but it was a little over 250,000 in 2018 (the last midterm in which Democrats were motivated by as much hatred as they now possess). Even with visions of 2018 dancing in Democrat heads, it's possible that turnout next week will not reach that 2022 number. As of 11/26, 84,000 votes had been cast either early or absentee. That doesn't sound like much to us, and low pre-election day turnout here -- if it stays low -- may actually favor Republicans. We'll see. There are still a few days of pre-election voting to come, and they could be busy days. Tennessee's 7th Congressional District is now rated as R+8 (Charlie Cook says R+10 based on his limited data). A rating of R+8 means that a Republican typically wins by 16 points. This race is going to be way closer than 16 points -- or even 10 points. As in nearly all special elections, Democrat money, organization and motivation are running very high, almost as high as Republican apathy. These factors, plus polling (such as it is) all indicate an outcome that is basically a tossup despite the overall Republican lean of the area. Prediction: We'll say Van Epps win by 2 or 3 points. If that estimate turns out to be significantly off the mark, it will be in the wrong direction -- just like many people's estimates in New Jersey and Virginia were on November 4th. Tags:
2025
Tennessee
Special election
| |||||||||||||||||||||||||||||||||||||||||||||||||||||||||||||||||||||||||||||||||||||||||||||||||||||||||||||||||||||||||||||||||||||||||||||||||||||||||||||||||||||||||||||||||||||||||||||||||||||||||||||||||||||||||||||||||||||||||||||||||||||||||||||||||||||||||||||||||||||||||||||||||||||||||||||||||||||||||||||||||||||||||||||||||||||||||||||||||||||||||||||||||||||||||||||||||||||||||||||||||||||||||||||||||||||||||||||||||||||||||||||||||||||||||||||||||||||||||||||||||||||||||||||||||||||||||||||||||||||||||||||||||||||||||||||||||||||||||||||||||||||||||||||||||||||||||||||||||||||||||||||||||||||||||||||||||||||||||||||||||||||||||||||||||||||||||||||||||||||||||||||||||||||||||||||||||||||||||||||||||||||||||||||||||||||||||||||||||||||||||||||||||||||||||||||||||||||||||||||||||||||||||||||||||||||||||||||||||||||||||||||||||||||||||||||||||||||||||||||||||||||||||||||||||||||||||||||||||||||||||||||||||||||||||||||||||||||||||||||||||||||||||||||||||||||||||||||||||||||||
| 11/20/2025: Senate Prospects For 2026: Part Two, Voting Schemes and Pipe Dreams [RightDataUSA] | |||||||||||||||||||||||||||||||||||||||||||||||||||||||||||||||||||||||||||||||||||||||||||||||||||||||||||||||||||||||||||||||||||||||||||||||||||||||||||||||||||||||||||||||||||||||||||||||||||||||||||||||||||||||||||||||||||||||||||||||||||||||||||||||||||||||||||||||||||||||||||||||||||||||||||||||||||||||||||||||||||||||||||||||||||||||||||||||||||||||||||||||||||||||||||||||||||||||||||||||||||||||||||||||||||||||||||||||||||||||||||||||||||||||||||||||||||||||||||||||||||||||||||||||||||||||||||||||||||||||||||||||||||||||||||||||||||||||||||||||||||||||||||||||||||||||||||||||||||||||||||||||||||||||||||||||||||||||||||||||||||||||||||||||||||||||||||||||||||||||||||||||||||||||||||||||||||||||||||||||||||||||||||||||||||||||||||||||||||||||||||||||||||||||||||||||||||||||||||||||||||||||||||||||||||||||||||||||||||||||||||||||||||||||||||||||||||||||||||||||||||||||||||||||||||||||||||||||||||||||||||||||||||||||||||||||||||||||||||||||||||||||||||||||||||||||||||||||||||||||
We've already covered the eight U.S. Senate seats which have the greatest probability of changing hands in 2026. The list includes 3 seats currently held by Democrats and 5 which have GOP incumbents. Most of the other 27 Senate seats which will have elections next year appear to be perfectly safe for the party which holds them. A few others fall just short of "perfectly safe".
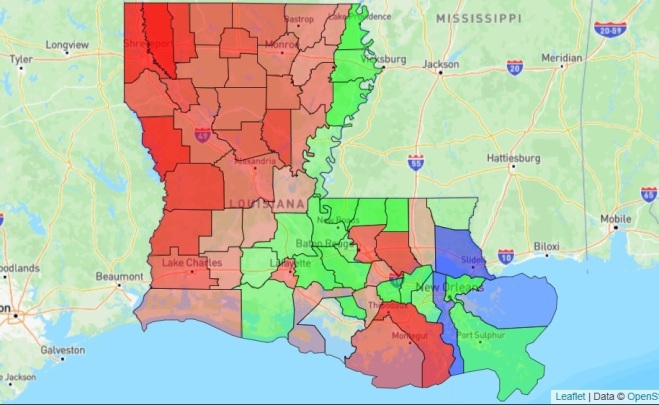
Louisiana gubernatorial jungle primary, 1987
Louisiana:

Photo of inmate No. 03128-095 from wwltv.com
What really triggered Edwards was the February, 1972 gubernatorial race, in which he first won the Democrat primary against over a dozen other candidates (but did not even get 25% of the vote) and then narrowly prevailed in a grueling runoff against Bennett Johnston and then had to face Republican David Treen in the general which turned out much closer than expected. Treen had cruised easily through the GOP primary and did not need to endure any runoff. So why, Edwards asked, should the vastly outnumbered Republican party be guaranteed a spot on a general election ballot like in every other state, while Democrats had to face as many as two bruising contests just to get to that same spot?
As of 2004 the tide had turned, and Democrats (and liberal Republicans) knew it. Then came the mass exodus of New Orleans Democrats as the result of Hurricane Katrina in 2005; New Orleans was already in population decline but the hurricane momentarily accelerated the process. From that point forward it has been Democrats who almost always find themselves on the outside in a general election, not simply because New Orleans temporarily lost about 100,000 potential voters, but because the general preference of Louisiana voters has done a 180-degree turn away from Democrats and towards Republicans. Since 2007 only Dirty Mary Landrieu in 2008 and John Bel Edwards (fluke wins in 2015 and 2019) have been able to prevail statewide as Democrats in Louisiana. Liberal Republicans like Bill Cassidy have (along with Democrats) lately decried the jungle primary, and in 2024 the state legislature passed a bill which reverts to closed, single-party primaries for elections for federal offices effective as of 2026; elections for state and local office in Louisiana will continue with the jungle primary. The new scheme is a "win" for liberals of both parties: Democrats get a guaranteed spot on a general election ballot; RINOs no longer need to deal with Democrats taking votes from them in a primary, and thus stand a better chance against real Republicans. In a supposedly "closed" GOP primary, Cassidy will receive a higher percentage of votes than he would in a jungle. He will be the winner if several conservative candidates split the right-wing vote while Cassidy has all of the left-wing votes for himself. Most likely, however, Cassidy will still need to survive a primary runoff. That won't be as difficult as it may sound. One very important provision of the new law which eliminated the jungle primary is that independent voters -- and there are plenty of those in Louisiana (nearly 30%) -- can cast a ballot in whichever primary they choose. Take a bunch of "moderate" independents, add in some Democrat voters who switch and become Republicans temporarily, and RINOs are suddenly far less endangered than they were before. If Cassidy's fate was decided only by true Republicans, it wouldn't be pleasant for him. Cassidy's #1 opponent at the moment is state Treasurer John Fleming, a 74-year-old Republican. Democrats have nobody worth mentioning. Fleming served 4 terms in the U.S. House from the 4th District from 2009-2016; the guy who replaced Fleming in that district in 2016 is now the Speaker of the House. Fleming is a very solid conservative, and if other conservatives stay out of the May, 2026 Senate primary, Fleming has an excellent chance to win. November would be a formality. But the primary will not be so simple, and that works to the advantage of RINO incumbent Cassidy because the non-RINO primary vote will be fractured. Other prominent candidates include first-term state Senator Blake Miguez, who is a moderate-conservative; and St. Tammany Parish councilwoman Kathy Seiden, who is a young, attractive Christian conservative. 
Photo credit: wwltv.com
Cassidy has a major cash advantage, Miguez and Fleming are building their war chests, and Seiden has only recently thrown her hat into the ring. Whoever wins the GOP primary will be Louisiana's next U.S. Senator. Miguez, though more of a centrist, will still take more votes from Fleming and Seiden than he will from Cassidy. Best case scenario is that at least one of the two actual conservatives makes the runoff. With one Democrat now guaranteed to be on the general election ballot (thanks again, Louisiana RINOs) billionaire ActBlue contributors may go all-out to try to steal this seat, but this is one state where it is very unlikely that they will succeed.
Alaska: 
Democrats have nobody yet for this race in what people falsely assume is a Republican state; the GOP has only 24% of voter registrations in Alaska while 59% are registered independents. But the Democrats believe (and left-wing polls back them up) that fake-moderate ex-congresswoman Mary Peltola would be a formidable opponent against incumbent Republican Dan Sullivan. Sullivan, an actual moderate, was first elected to the Senate in 2014 when he defeated incumbent Democrat Mark Begich and then was re-elected in 2020 by an unimpressive margin over big-spending liberal Al Gross.
Kentucky: 
Photo credit: Lexington Herald Leader
The Bluegrass State is wide open due to the long-overdue retirement of Mitch McConnell. The best-known candidates in the Republican primary are moderate congressman Andy Barr and former Attorney General Daniel Cameron. Barr has represented the Lexington-area district in Congress since 2013 and he's turned what was once a marginal House seat into a rather safe one which Democrats no longer seriously go for in most elections; they are putting it back on their radar in 2026, however. Cameron, elected as A.G. in 2019, was seen by some on the right as insufficiently tough on Democrat crimes while in office, and his bid to move up to Governor ended dismally when he was totally outclassed (and vastly outspent) in 2023. There is also businessman Nate Morris running on the GOP side, and he is definitely the most conservative option of the three. Barr is currently the leader in the fundraising portion of the race.
A recent addition on the Democrat side, presumably for additional comic relief, is horse trainer Dale Romans. Horses are big in Kentucky, and this guy's full of as much horseshit as any of them. He also wants to be the W.C.H. candidate in the contest, and describes himself as an "independent" Democrat even as he spouts the same nonsense as all other (presumably non-independent) Democrats. Bernie Sanders is an "independent" too. McGrath is the most likely of the above to be the Democrat nominee, but nobody currently has any illusions that she will win. Morris may have a better shot than anticipated on the GOP side, but a squish like Barr probably has the best chance of winning a general election, and therefore the big money and big endorsements will be behind him. Cameron is currently being slimed with unproven allegations of misconduct while Attorney General, and he is also a proven statewide loser. Cameron appears to be the favorite to finish third in the GOP primary. Minnesota: 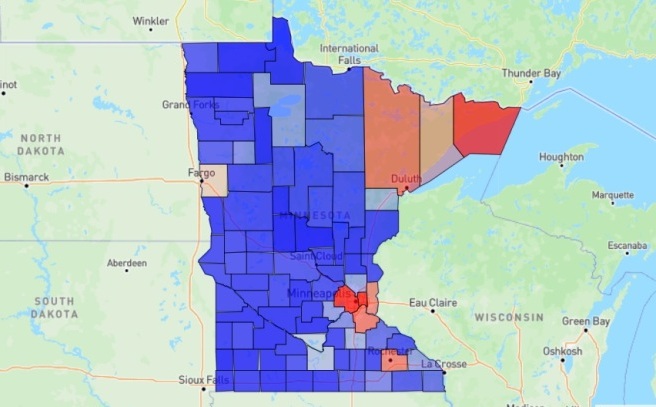
2024 presidential results in Minnesota
This state, like Virginia (see below) is nothing but a Republican pipe dream. The congressional delegation is always pretty well balanced, either 4-4 or 5-3 every election since 2000. The state House and state Senate are very close. Minnesota doesn't register voters by party, but a company whose business it is to estimate party breakdowns calculates that Minnesota is one-third Democrat, one-third Republican and one-third independent or minor parties. This may be an oversimplification, but the Twin Cities and their suburbs (at least the first two "rings") are terrible, the rest of the state is fine. The first part of that sentence is definitely true, anyway.
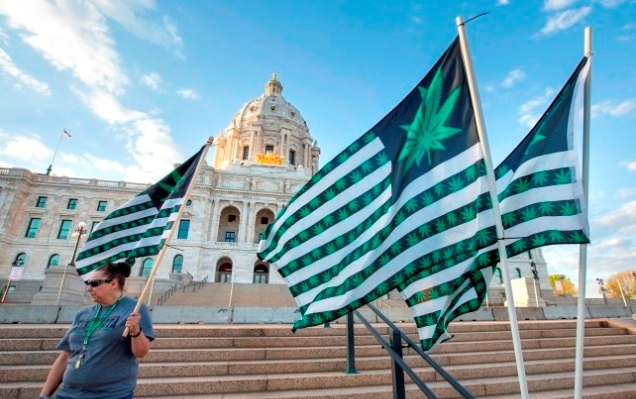
Photo credit: house.mn.gov
Speaking of "pipe dreams". . . one explanation for some of the previously close outcomes is -- or was -- the presence of doper parties on the ballot. The "Grassroots-Legalize Cannabis" party and the "Legal Marijuana Now!" party are both recognized political entities in Minnesota, but they ceased fielding candidates after 2022. That's because they no longer have any reason to do so; in 2023 the Democrat legislature passed a very lenient law which legalizes cannabis for any type of use, not just medicinal. The fact that the doper parties are now obsolete helps Democrats, because these parties were regularly siphoning off thousands of left-wing votes in major elections.
Republicans are pretending that they have a chance to pick up the Minnesota Senate seat in 2026. It is an open seat, being vacated by Democrat Tina Smith, who is retiring. Smith, who compiled a nearly 100% liberal rating while in the Senate, was first appointed in 2018 when Democrats forced another liberal Democrat, sexual predator Al Franken, to resign. Smith's most recent election in 2020 was a good example of how Democrats were once hindered electorally, as two stoner candidates combined to take 7.7% of the vote away from her. So Smith only won by about 5 points instead of 12 or 13 points. The 2026 Democrat primary will be between Lt. Governor Peggy Flanagan and congresswoman Angie Craig. Flanagan has some problems, such as financial improprieties in her office, and being endorsed by Bernie Sanders; Craig is one of those lifelong liberals who suddenly sprints hysterically towards the center when seeking higher office. There's a 98% chance (rounding down) that one of these two will be the next ultra-liberal U.S. Senator from the state of Minnesota. Ex-professional basketball player Royce White ran for the Senate in 2024 in Minnesota against Amy Klobuchar, and the Republican was stomped by over 15 points, a good example of a margin of Democrat victory when the dopers no longer split the left-wing vote. He is running again in 2026. White moved quickly across the political spectrum, going from left-wing hero in 2020 when he was leading Black Lives Matter protests after the death of "St. Floyd of Fentanyl" (White does have a history of mental illness); he's recovered from that, and is now described as a "right-wing populist". White has just as much chance of winning in 2026 -- none at all -- as he had in 2024. And he is the probable front-runner among Republicans, which shows just how much of a barren wasteland Minnesota is for the GOP. None of the state's 4 moderate Republican congressmen want any part of this race either. 
Photo credit: yahoo.com
This foregone conclusion of an election might be spiced up a bit if ex-sports broadcaster Michele Tafoya were to enter the race on the GOP side. Tafoya was a long-time sideline reporter for NFL games, and during her career she was employed by several networks including CBS, ESPN and NBC. She retired from that profession in January, 2022; the last game she worked was Super Bowl LVI.
Nebraska: 
Photo credit: Zach Wendling/Nebraska Examiner
Democrat-in-disguise Dan Osborn is the Great "Independent" Hope for the left in the state of Nebraska. Fresh off of a defeat in the 2024 Senate election against incumbent GOP squish Deb Fischer in which he came closer than some expected, Osborn is rested and ready to give it another go in 2026. Osborn took all of the Democrat money he could get in 2024, but concealed his true political identity by refusing to accept the Democrat party label which is repugnant in the Cornhusker State outside of Omaha and Lincoln. Not even including all of the supposedly-independent liberal cashflow coming from outside the state, Osborn's fundraising dwarfed that of Fischer. Numerous polls showed a close race in 2024, and some even had Osborn prevailing by a small amount. Osborn won the two big liberal cities and lost everywhere else; the final outcome was a 6.7% victory for the Republican. Only one or two forecasters actually got it right; the other polls (nearly all of which were paid for by Osborn's campaign) were nothing but wishful thinking, propaganda and hot air.
Virginia: One last word about a ridiculous GOP pipe dream state: there are probably some folks out there who are still in disbelief regarding the 2025 election results in Virginia. Unwilling to accept the reality that the Old Dominion is not remotely competitive anymore, they may think that outgoing Republican Governor Glenn Youngkin could somehow repeat his fluke win from 2021 in the 2026 Senate race against well-entrenched liberal Mark Warner. Youngkin is a good man, and he stood up just recently against Virginia Democrats' attempt (which will succeed) to gerrymander the state's congressional districts and disenfranchise Republicans, costing them 2 or perhaps 3 seats. Youngkin is not a stupid man, and to all indications will not be entering a Senate race that he is extremely unlikely to win. If Youngkin declines, Republican pickup chances of the Virginia Senate seat drop from maybe 20% to absolute zero. Drop the pipe, wake up from the dream, and look elsewhere for potential Republican pickups. Tags:
2026
Senate
Louisiana
Alaska
Kentucky
Minnesota
Nebraska
Virginia
| |||||||||||||||||||||||||||||||||||||||||||||||||||||||||||||||||||||||||||||||||||||||||||||||||||||||||||||||||||||||||||||||||||||||||||||||||||||||||||||||||||||||||||||||||||||||||||||||||||||||||||||||||||||||||||||||||||||||||||||||||||||||||||||||||||||||||||||||||||||||||||||||||||||||||||||||||||||||||||||||||||||||||||||||||||||||||||||||||||||||||||||||||||||||||||||||||||||||||||||||||||||||||||||||||||||||||||||||||||||||||||||||||||||||||||||||||||||||||||||||||||||||||||||||||||||||||||||||||||||||||||||||||||||||||||||||||||||||||||||||||||||||||||||||||||||||||||||||||||||||||||||||||||||||||||||||||||||||||||||||||||||||||||||||||||||||||||||||||||||||||||||||||||||||||||||||||||||||||||||||||||||||||||||||||||||||||||||||||||||||||||||||||||||||||||||||||||||||||||||||||||||||||||||||||||||||||||||||||||||||||||||||||||||||||||||||||||||||||||||||||||||||||||||||||||||||||||||||||||||||||||||||||||||||||||||||||||||||||||||||||||||||||||||||||||||||||||||||||||||||
| 11/17/2025: Senate Prospects For 2026: Part One, The Flippables [RightDataUSA] | |||||||||||||||||||||||||||||||||||||||||||||||||||||||||||||||||||||||||||||||||||||||||||||||||||||||||||||||||||||||||||||||||||||||||||||||||||||||||||||||||||||||||||||||||||||||||||||||||||||||||||||||||||||||||||||||||||||||||||||||||||||||||||||||||||||||||||||||||||||||||||||||||||||||||||||||||||||||||||||||||||||||||||||||||||||||||||||||||||||||||||||||||||||||||||||||||||||||||||||||||||||||||||||||||||||||||||||||||||||||||||||||||||||||||||||||||||||||||||||||||||||||||||||||||||||||||||||||||||||||||||||||||||||||||||||||||||||||||||||||||||||||||||||||||||||||||||||||||||||||||||||||||||||||||||||||||||||||||||||||||||||||||||||||||||||||||||||||||||||||||||||||||||||||||||||||||||||||||||||||||||||||||||||||||||||||||||||||||||||||||||||||||||||||||||||||||||||||||||||||||||||||||||||||||||||||||||||||||||||||||||||||||||||||||||||||||||||||||||||||||||||||||||||||||||||||||||||||||||||||||||||||||||||||||||||||||||||||||||||||||||||||||||||||||||||||||||||||||||||||
We have already examined the outlook for 2026 in the aftermath of the 2025 elections. Most of that commentary focused on the U.S. House and how the results from the last disastrous midterm election (2018) might foreshadow the upcoming potentially disastrous midterm election. We spent little time on the Senate, but noted that although 2018 was a train wreck for Republicans over almost the entire ballot, there was one minor exception: Republicans actually gained 2 Senate seats in 2018 and with some luck it could have been as many as 6. Because it was only a net +2, most observers on the right were extremely disappointed. Yet holding onto the Senate at all in 2018 was an important accomplishment and an impressive one under the circumstances. It kept rabid Democrats at least partially at bay. Recall what Democrats did with their total control of the House, and imagine what would have occurred with them in charge of the Senate during the final two years of Trump's first term in the White House.
It is not the same in the Senate, where an entirely different set of Senate seats from 2018 will be contested in 2026, and that makes specific comparisons to 2018 impossible. Members of the "Class of 2018" completed their six-year terms in 2024; it is the "Class of 2020" which is up next year. Only one incumbent Senator who was elected in 2018 -- Mississippi Republican Cindy Hyde-Smith -- will be on the ballot again in 2026. That's because her 2018 win took place in a special election for a 2-year term. Unlike 2018, 2020 was not a good year at the Senate level for the GOP. They suffered a net loss of 3 seats, turning their 53-47 majority into a 50-50 tie which was broken by the newly-elected Democrat Vice President. The Republican majority was still intact (52-48) in November; GOP control wasn't actually forfeited until January of 2021 when Democrats won two runoff elections in Georgia. Republican incumbents had lost in two other states (Arizona, Colorado) in November but the GOP picked up Alabama. Democrats tried to purchase a much better Senate result than merely +3 in 2020, spending ungodly amounts of money in losing efforts in states such as Alaska, Iowa, Kansas, Kentucky, Maine, Mississippi, Montana, North Carolina and South Carolina (outspending the victorious GOP candidate in every one of them). That was in addition to the ungodly amounts of money the Democrats spent in their winning efforts. According to OpenSecrets.org, Democrats in the 2020 general election spent over $1.1 BILLION dollars to acquire control of the Senate, an amount of money 60% higher than Republicans could come up with. Campaign finance will be a recurring theme in the 2026 previews below, with Democrats just about 100% guaranteed to obtain more money than their Republican counterparts in every state where there is even the slightest chance that Democrats can compete -- -- unless the Democrats and their "ActBlue" money laundry are finally forced to obey the same campaign finance rules that Republicans have to live by. 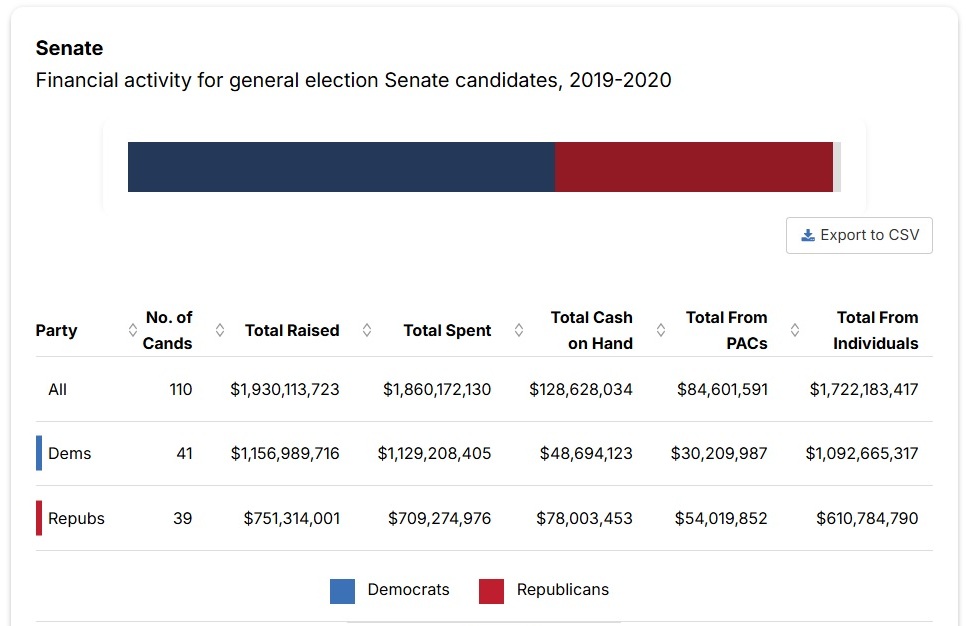
Source: OpenSecrets.org
The current Senate terrain is not as favorable as it was in 2018, when Democrats had to play defense in most of the contested states. In 2026 Republicans have 22 seats to defend (including special elections in Florida and Ohio) while Democrats are up in only 13 states. Of those 13, just 3 present any real opportunity for a GOP gain while there are a minimum of 5 juicy targets for Democrats this time around. All things considered, the playing field is clearly tilted towards the left here.
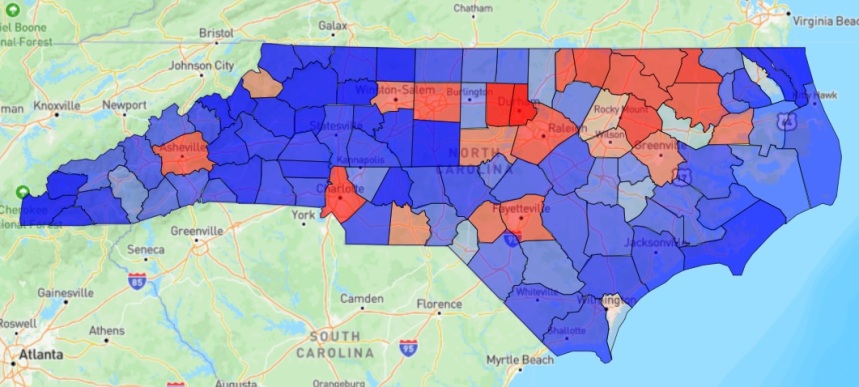
North Carolina Senate results from 2020
1. North Carolina:
Liberal former congressman Wiley Nickel was the first to jump in on the Democrat side, but he was merely a placeholder until phony moderate ex-Governor Roy Cooper made his decision to go for the Senate. To nobody's surprise, Cooper declared his candidacy in late July and within hours received millions of dollars in possibly-legal campaign donations. The latest financial reports from the FEC show Cooper with nearly 8x the amount of cash as Whatley. Cooper will probably eventually raise and spend at least $100 million here; Whatley will never get close in that department. Though out of office for nearly a year now, Cooper is still very popular in the Tarheel State -- at least with the liberal media, who never tire of reporting how popular Cooper is. For all his alleged popularity, Cooper's electoral record isn't very impressive in this closely-divided "purple" state. He was sufficiently well-liked to win 4 terms as state Attorney General, but his percentages as Governor were 49.0% in 2016 and 51.5% when being re-elected in 2020. Cooper's first gubernatorial win was aided by hysteria over the so-called "Bathroom Bill" which was passed by the Republican-controlled North Carolina legislature and signed by Republican Governor Pat McCrory in 2016. A bathroom bill is legislation that protects the safety and privacy of girls and women in public bathrooms against intrusion by boys or men who claim (or pretend) to be transgendered. You can understand why Democrats would be indignant about something like that. The liberal media concocted some figures purporting to show that the bill would cost North Carolina a hillion jillion dollars in lost revenue because woke companies (like PayPal and Adidas) and woke organizations (like the NCAA) would pull out of the state. The 2016 gubernatorial election turned on this single issue, with Cooper supporting the efforts of Organized Deviancy and McCrory supporting common sense. Common sense was defeated that November, 49.0% to 48.8% with a Libertarian spoiler taking enough votes from McCrory to hand the win to the Democrat without a majority. The Republican legislature caved early in 2017 and repealed the bill. Cooper's far-left stance on most issues is well-known to North Carolina voters despite the best efforts of the media. Republican Lt. Governor Dan Forest challenged Cooper in 2020, but lost by 4.5%. Forest was banking on voter disapproval of Cooper's authoritarian tactics during the COVID plandemic, but the voters weren't disapproving enough. Natural (or even laboratory-made) disasters seem to work in favor of Democrats in North Carolina despite that party's inept or ham-fisted approach to the problems; for example, the inept and even criminally negligent response to Hurricane Helene in 2024 -- Joe Biden's FEMA refusing to help people who had "Trump" signs in their yards (they did the same thing in Florida too), and local Democrats' relief efforts discriminating against Whites -- was supposed to be a boon for the GOP in that year's elections; Trump did win the state, but the most-affected areas in Western North Carolina actually moved to the left. Trump's win was a close one, and other Republicans on the ballot received no boost at all from the Democrats' mishandling of the hurricane aftermath. Speaking of disasters, Whatley is likely to help fulfill the media's mission of making Cooper look more popular than ever. The Republican nominee will be grossly underfunded and largely uninspiring to the voters. Early polls are exactly as one might expect: Cooper with a lead but running under 50% for now. At least 10-15% of the electorate is still undecided, which is also what one might expect. This race is, and always has been, Cooper's to lose. Another potential dire consequence is this: if Whatley loses convincingly next November, there are several Republican House incumbents in North Carolina who could go down with him because most GOP districts in the state are either in the tossup range or very close to it. 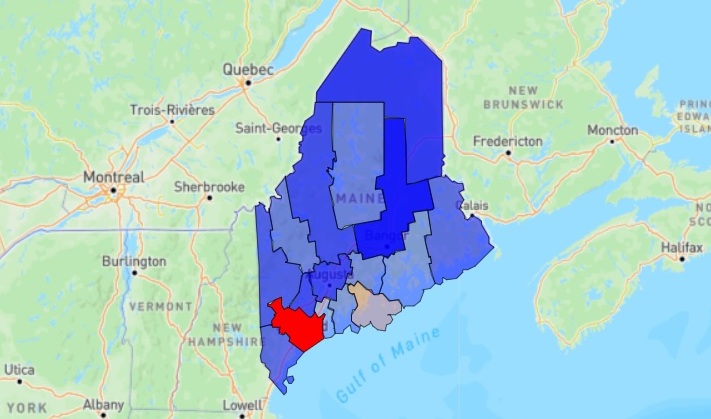
Maine Senate results from 2020
2. Maine:
Georgia Senate results from 2020 runoff
3. Georgia:
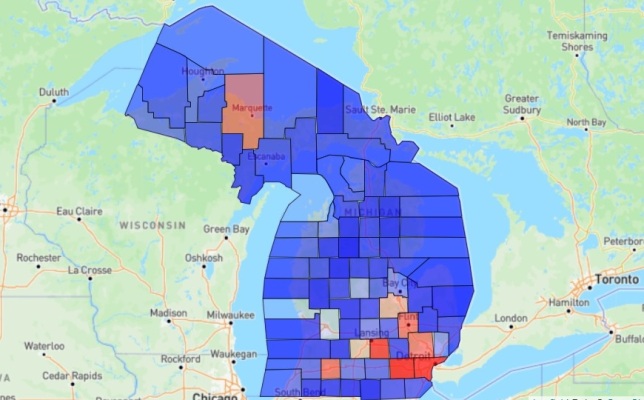
Michigan Senate results from 2020
4. Michigan:
5. New Hampshire: Seventy-eight-year-old Democrat Senator Jeanne Shaheen is ending her political career in 2026 after 6 years as New Hampshire Governor followed by 18 years in the Senate. After her 3 terms in Concord her string of election wins was interrupted in 2002 when she ran against incumbent Senator Bob Smith. Only it turned out that Smith wasn't her #1 opponent that year after all -- Smith lost in the primary to congressman John E. Sununu who, despite being outspent by both Shaheen and Smith, won just over 50% of the vote in the 2002 Senate election. He was the youngest member of the Senate during his term. Shaheen won the rematch 6 years later and held the Senate seat for two more terms after that. Sununu had been out of politics since his 2008 defeat, but he's back for another go at it. Do not confuse this Sununu with his younger brother Chris, who is the former Governor of New Hampshire (2017-2024). Also do not confuse him with his father John H. Sununu, who was George H.W. Bush's Chief of Staff. That Sununu is the one who gave us John Souter as a Supreme Court justice and who convinced his employer that "read my lips, no new taxes" was somehow not a good idea and shouldn't be taken literally. Sununu's employer's reward for following that advice was a trip to the unemployment line after 1992. 
Photo credit: John H. Sununu
Chris and his father are RINOs, if not outright Democrats; John E. Sununu is the conservative in the family. By "Sununu" standards, anyway. He's one of those oxymoronic "fiscal conservatives" now (i.e. anti-conservative on every other issue). There's no such thing as a fiscal conservative/social liberal. Because "social liberalism" is clearly anything but fiscally conservative when you look at how much those social programs cost.
Just as Sununu had to face an experienced senator (Bob Smith) in the GOP primary during his first run for that office in 2002, he will be facing another one in 2026 -- ex-Massachusetts Senator Scott Brown, who was a fluke winner in 2010 to replace the deceased Teddy Kennedy. Brown won 52% of the vote against Democrat Attorney General Martha Coakley. How repugnant do you have to be to lose to a Republican in Massachusetts? Coakley's done that twice. Brown started off as a moderate in the Senate, but even running hard to the left was not enough to save him in 2012. Brown did run well ahead of Mitt Romney in Massachusetts that year, and in both of his Senate races he showed an ability to run neck-and-neck against Democrats in terms of campaign cash. Brown relocated to the north by 2014 and ran again for Senate in his new home state of New Hampshire. In that year's crowded GOP primary, one of the defeated candidates was good old (age 73) Bob Smith again. Brown came reasonably close to defeating Shaheen, but this time he was conclusively outspent and that was a major factor, as of course were the "carpetbagger" allegations though Brown was actually born in New Hampshire. Bob Smith, by the way, is still around and has endorsed Brown for 2026. Instead of attacking each other too much (yet), both Sununu and Brown are training their artillery mainly on presumptive Democrat nominee Chris Pappas, who is currently the congressman from New Hampshire's 1st District. Pappas is in his fourth term and, like so many other liberal Democrats who seek higher office in states which are not solid "blue", has suddenly pretended to discover moderation after being nearly a 100% party-line liberal vote prior to 2025. Sununu, who only jumped into the race recently, is the current favorite for the GOP nomination and matches up better against Pappas in general election polling. New Hampshire is about as closely divided a state as there is, but Democrats always seem to eke out victories and 2026 isn't likely to be any different. This race is definitely a toss-up, but there's a strong likelihood that the Republican will be the one getting tossed (out), albeit not by a very large amount. 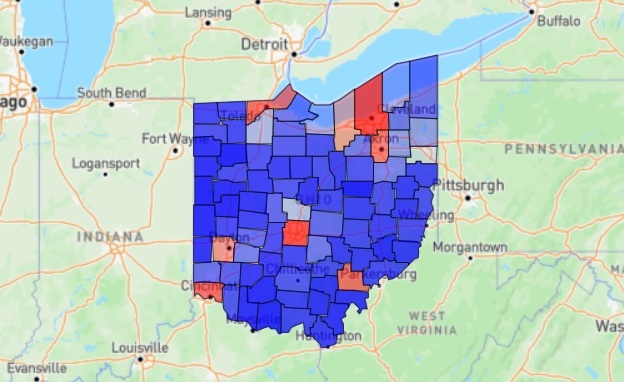
Ohio Senate results from 2024
6. Ohio:
Brown's luck -- but not his money -- finally ran out in 2024. Brown and the Democrat Money Machine spent over $100 million to repurchase his Senate seat, but Republican Bernie Moreno was able to ride Trump's coattails to a 3.6% win after trailing in all polls until October. Moreno, though outspent 4:1 and overwhelmed by Brown's advertising presence in all types of media, won every Ohio county except the urban ones, one suburban county (Lorain) near Cleveland, and the academic wasteland of Athens County (University of Ohio). Moreno prevailed by over 200,000 votes in all. With Ohio Democrats having nowhere else to turn in 2026 -- ex-congressman Tim Ryan declined and so did a couple of ghetto congresswomen -- Brown was tabbed to try to regain the Senate seat he occupied as recently as a few months ago. Ryan had run for the Senate in 2022 against Vance and suffered a humiliating loss despite having the usual astronomical cash and media advantages which accrue to Democrats even in GOP states. It's not quite accurate to say that Ohio Democrats had nobody else willing and (financially) able to oppose Jon Husted. A Cleveland-area millionaire Democrat named Fred Ode jumped into the Democrat primary back in August and prepared to invest $5 million of his own money to show he was serious. Ode entered the Democrat primary because he feels that "old-school" Democrats like Sherrod Brown are not filled with sufficient hatred of Donald Trump and all other Republicans. For that reason, Ode believed that someone like Brown was unlikely to win against Husted next year. Ode definitely has a point about hatred being the ultimate motivator for Democrat voters (or have we already forgotten the election results from earlier this month?). However just a few days ago Ode suddenly and mysteriously aborted his campaign which was still in its first trimester. Clearly angry (apparently as usual for him), Ode still did not give a reason. Perhaps Ode made his decision after finding a decapitated horse's head in his bed one morning? The Democrat establishment is every bit as capable of hatred and violence as the insurgents from the far left. Radicalism may work well for Democrats in New York City and California and (soon) Maine or even Texas -- and don't forget Virginia now -- but not necessarily in middle-America, apple-pie Ohio. Democrat leaders feel that their chances in Ohio are much better with Brown than with Ode or someone like him. For 2026, early polls showed Husted moderately ahead of Brown but recent Democrat-leaning polls have it pretty much a tie. Ohio, along with Maine and North Carolina, could flip from R to D next year and result in a 50-50 tie for the Republicans in the Senate if those losses are not offset elsewhere. Any additional Republican losses in the Senate would hand control to Democrats. With the Senate almost within their grasp, Democrat billionaires will be tossing around campaign cash like never before, and things like a Republican being outspent only by a margin of 4:1 will seem quaint. 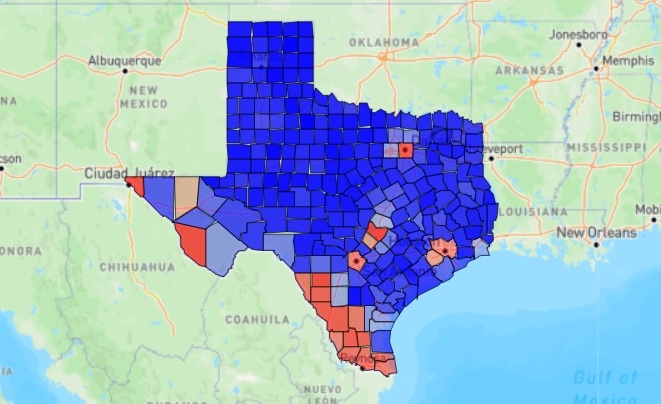
Texas Senate results from 2020
7. Texas:
On the GOP side in Texas in 2026, we'll have incumbent senator John Cornyn vs. state Attorney General Ken Paxton vs. congressman Wesley Hunt. On the left, we'll have ex-congressman Collin Allred (back for a second try at higher office) vs. state House member Holy James Talarico. A late addition to the tag team could be congresswoman Jasmine Crockett, the self-appointed moral voice of the shrieking, hysterical (but dominant) wing of the Democrat party, and darling of the radical-left media. She believes herself to be the Texas version of AOC, and presumably considers that designation a complement. Crockett already has raised at least $6.5 million (which is more than Talarico or Allred have done), and that's far more money than necessary for her to run in some little House district which is rated at least D+10 and will have no viable GOP alternative. It certainly looks like she's running for the Senate, but we'll have to wait to find out for sure. Queen Latifah Crockett has declared that she will make her solemn pronouncement at the filing deadline, which is December 8. What reason would there be for her to not run for Senate? Aside from avoiding the risk of losing in the Senate primary, Crockett may realize that another easy House win in her district -- combined with the reasonable likelihood of Democrats taking control of the House after 2026 -- would give her a position of greater power and perhaps a juicy committee chairmanship. Worst-case scenario for Crockett is that she loses the Senate primary, is out of Congress starting in 2027, but then is hired by "The View", which obviously can never have enough shrill, unattractive women on its panel. 
Photo credit: splinter.com
Talarico describes himself as a deeply religious Christian, but is a phony who spouts that "Jesus-was-a-liberal" bullshit a la the self-righteous "He Gets Us" television ad campaign, which you may have seen. Picture Talarico as a combination of Bernie Sanders and Jimmy Swaggart (apologies to Swaggart). Talarico the "True Christian" adamantly opposed displaying the Ten Commandments in Texas schools, preferring that those institutions remain atheistic and free from anything which might accidentally encourage good moral values. He represents an ultra-liberal (D+26) Austin district in the state House, so Talarico's views are surely considered to be mainstream by his constituents but most of the rest of the state of Texas would disagree. Talarico is a one-trick pony, wearing his version of far-left Christianity on his sleeve at all times and using it to explain all of his immoral, pro-abortion, pro-crime and other radical votes in the legislature. He surely believes he can "out-liberal" and "out-hate" Crockett and Allred, but he's got his work cut out for him in those departments.
Senator Cornyn is a squish but he is always a well-funded one. The 73-year-old has been in the Senate since 2003. He compiled a conservative voting record during his first two terms, but now has become so unreliable (i.e. "moderate") that he was actually eligible to apply for the job of Senate Majority Leader after Mitch McConnell stepped aside. No true conservatives need apply for that position, which was won by John Thune in a November, 2024 secret ballot of GOP senators. The outcome was said to be close. Cornyn has been in a panic throughout 2025, awkwardly trying to appear conservative (at least through next March's primary), furiously raising money and becoming more popular with the media as he and his allies toss allegations at his closest challenger, Ken Paxton. 
This is nothing new for Ken Paxton. The former state legislator was first elected as Texas Attorney General in 2014, succeeding Greg Abbott in that office as Abbott stepped up to become Governor. The solidly-conservative Paxton quickly showed that he was (and still is) one of the most effective A.G.'s in the entire country. However he is much too effective to suit the RINOs who perpetually have control of the Texas GOP and the Texas state House; Democrats loathe him even more than RINOs do.

Photo credit: Texas Scorecard
As noted above, the GOP primary is not just a 2-way race anymore. In October, congressman Wesley Hunt announced that he would abandon his safe (R+10) district in the suburban Houston area and join the Senate race. The 44-year-old Hunt has a fine military background, graduating from West Point in 2004, serving 8 years in the U.S. Army before earning 3 Masters' Degrees, and then entering politics. Hunt's first bid for Congress came in 2020 in the deteriorating 7th District and was unsuccessful though he made a solid showing (47.5%) under difficult circumstances. When the new 38th District was created in 2022 in approximately the same area, Hunt won a majority in a crowded 10-way Republican primary and then easily sealed the deal in November. Hunt was re-elected in 2024 with only token opposition, and has been a reliable conservative vote in the House. He currently trails his primary opponents in fundraising (and is way behind the wealthy Democrats) but he's only been in the race for about 6 weeks.
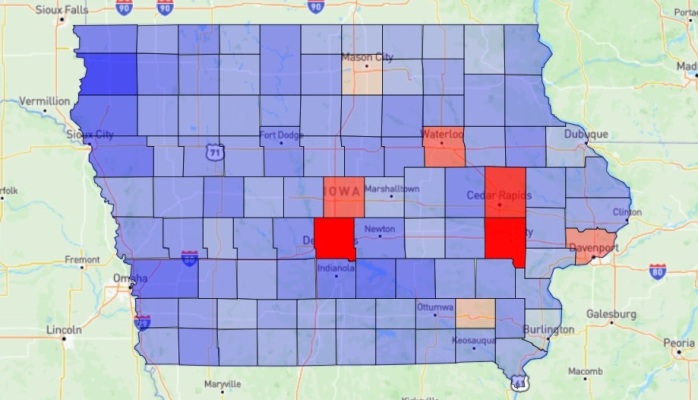
Iowa Senate results from 2020
8. Iowa:
Tags:
2026
Senate
North Carolina
Maine
Georgia
Michigan
New Hampshire
Ohio
Texas
Iowa
| |||||||||||||||||||||||||||||||||||||||||||||||||||||||||||||||||||||||||||||||||||||||||||||||||||||||||||||||||||||||||||||||||||||||||||||||||||||||||||||||||||||||||||||||||||||||||||||||||||||||||||||||||||||||||||||||||||||||||||||||||||||||||||||||||||||||||||||||||||||||||||||||||||||||||||||||||||||||||||||||||||||||||||||||||||||||||||||||||||||||||||||||||||||||||||||||||||||||||||||||||||||||||||||||||||||||||||||||||||||||||||||||||||||||||||||||||||||||||||||||||||||||||||||||||||||||||||||||||||||||||||||||||||||||||||||||||||||||||||||||||||||||||||||||||||||||||||||||||||||||||||||||||||||||||||||||||||||||||||||||||||||||||||||||||||||||||||||||||||||||||||||||||||||||||||||||||||||||||||||||||||||||||||||||||||||||||||||||||||||||||||||||||||||||||||||||||||||||||||||||||||||||||||||||||||||||||||||||||||||||||||||||||||||||||||||||||||||||||||||||||||||||||||||||||||||||||||||||||||||||||||||||||||||||||||||||||||||||||||||||||||||||||||||||||||||||||||||||||||||||
| 11/13/2025: An Electoral S.A.T. Math Question: "2025 Is To 2017 As 2026 Is To ____ ?" [RightDataUSA] | |||||||||||||||||||||||||||||||||||||||||||||||||||||||||||||||||||||||||||||||||||||||||||||||||||||||||||||||||||||||||||||||||||||||||||||||||||||||||||||||||||||||||||||||||||||||||||||||||||||||||||||||||||||||||||||||||||||||||||||||||||||||||||||||||||||||||||||||||||||||||||||||||||||||||||||||||||||||||||||||||||||||||||||||||||||||||||||||||||||||||||||||||||||||||||||||||||||||||||||||||||||||||||||||||||||||||||||||||||||||||||||||||||||||||||||||||||||||||||||||||||||||||||||||||||||||||||||||||||||||||||||||||||||||||||||||||||||||||||||||||||||||||||||||||||||||||||||||||||||||||||||||||||||||||||||||||||||||||||||||||||||||||||||||||||||||||||||||||||||||||||||||||||||||||||||||||||||||||||||||||||||||||||||||||||||||||||||||||||||||||||||||||||||||||||||||||||||||||||||||||||||||||||||||||||||||||||||||||||||||||||||||||||||||||||||||||||||||||||||||||||||||||||||||||||||||||||||||||||||||||||||||||||||||||||||||||||||||||||||||||||||||||||||||||||||||||||||||||||||||
The election results from November 4, 2025 bear a striking resemblance to those from November 7th of 2017. In the aftermath of the 2025 Democrat sweeps in Virginia, New Jersey, New York City -- and elsewhere -- most right-wing analysts are trying to appear calm as they whistle past the graveyard in their attempts to dismiss the disaster as "completely expected", "limited to 'blue' states", "unimportant" and, most of all, "meaningless as far as next year's midterms are concerned".
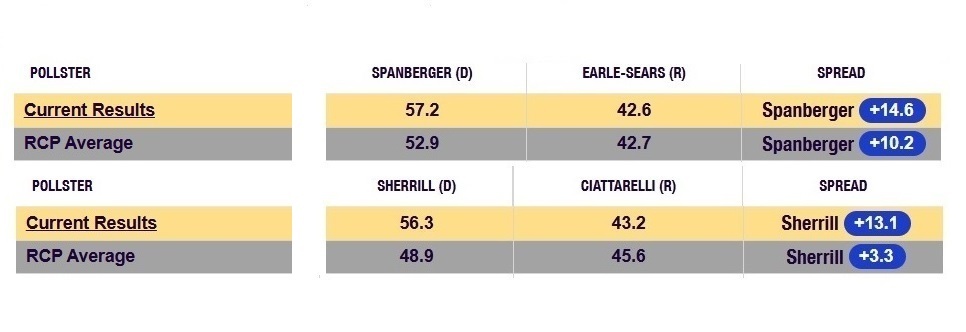
The polls sure were wrong -- but not the way we wanted them to be.

Possibly thinking: "Wow, the voters agreed with me! Republicans (and their children) DO deserve to die!"
Regarding the Republicans' gubernatorial defeats: it's one thing to be expected to lose, it's another thing to be completely obliterated and to have the calamity permeate the entire election ballot to the point where Republicans also hemorrhaged seats in the Virginia House of Delegates and the state Assembly in New Jersey.

In 2025, Democrats cemented their control of the PA Supreme Court for years to come.
Pennsylvania voters had the opportunity to send those judges packing. Instead, all three judges who were up for retention were overwhelmingly returned (by nearly 25-point margins) to the court for another 10-year term. The PA Democrat Supreme Court thus maintains its 5-2 majority, and one of the two Republicans on the court barely qualifies as such; there is only one true Republican out of seven judges on the PA Court.
"Unimportant". . . "Not a big deal": Virginia, like some other solid "blue" states, is considering congressional re-redistricting. Virginia Democrats, soon to be in complete control of state government, would like to imitate California and disenfranchise Republicans via extreme gerrymandering. The results from last Tuesday surely embolden those Democrats. A small minority of New York City voters just elected a radical alien socialist as mayor. Tell the good people of California, Virginia and New York City that these results are "not a big deal". But the tiny, fragile twig that GOP pundits are seriously attempting to hang their hats on is this one: These results mean nothing for the future because "things change", "twelve months is an eternity in politics", blah blah blah. Platitudes, wishful thinking and other drivel are a poor substitute for actual analysis. On this website, we look at data rather than "feels". With the results from 2025 being so uncannily similar to the ones from 2017, it would be idiotic not to examine the results from 2018 and see how they might be pertinent to the upcoming 2026 midterms even if those midterms are "an eternity" away at this moment. The similarity of 2017 to 2025 is parallel to the relationship between 2016 and 2024. In 2016 Donald Trump won the presidency with 304 electoral votes and took 30 states. He won 45.9% of the popular vote. In 2024 Trump won the presidency again, this time with 312 electoral votes and 31 states (adding Nevada). He received 49.7% of the popular vote, the improvement coming not at the expense of his Democrat opponent but from the deterioration of third-party candidates, whose vote share was 4% less in 2024 than it had been in 2016. Kamala Harris actually took a greater percentage of the popular vote (48.2%) than Hillary Clinton had (48.0%). The parallel doesn't quite carry over to the House, where Republicans were in much better shape after 2016 than they are after 2024 (a net loss of 21 seats). But that's mainly because of what happened in 2018 -- which is the whole point here -- with the GOP losing many seats. Those losses were only partially offset in 2020 and 2022. After 2016 Republicans controlled the Senate by 52-48. After 2024 they now have a 53-47 advantage. That's pretty similar. Having compared 2024 to 2016, let's now shift one year and consider 2025 vs. 2017. Because 2021 was a significant factor in the false optimism which accompanied future elections in New Jersey and Virginia, we will show data for that year as well. 2017:
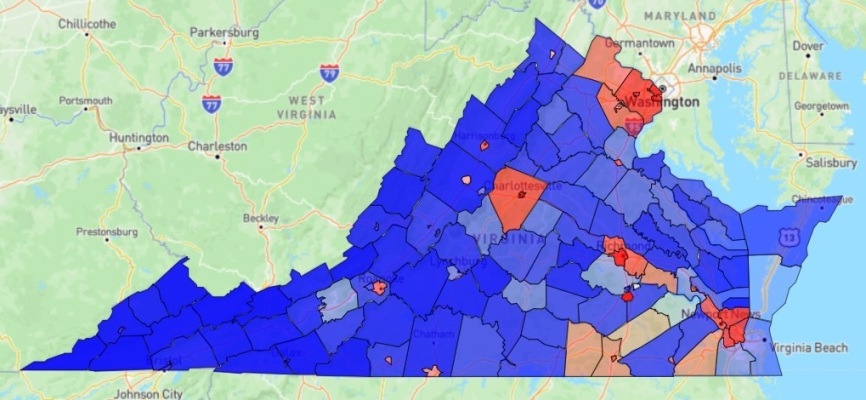
Happier days: 2021 gubernatorial election results in Virginia 2021:
Adding to the false hope in NJ was Trump losing by "only" 5.9% in 2024 and Curtis Bashaw losing by only 9.7% for the Senate. Also there was a voter registration shift to the right, a net change of 100K between 2022 and 2024, but the Rats were still up 900K (13.5%). In 2025 things improved, with the GOP being down 855K and 12.9%. Whoopee. As far as the 2025 elections in New Jersey were concerned, that wasn't false hope -- that was no hope. Turnout helped Republicans overcome some of their disadvantages in NJ in 2021 (registration deficit and state-level gerrymander) but things would return to normal in 2025 despite the indications from some occasionally cheery -- but sadly inaccurate -- pre-election polls. In Virginia there was an actual basis for hope after 2021 -- for a little while. There are no partisan voter registration stats to go by, however the election results were so encouraging that Republicans were expecting further gains in 2023 and 2024. In 2023 they failed to pick up the one state Senate seat they needed to get to 20-20 (GOP Lt. Governor would break the tie), and they lost 3 seats in the state House of Delegates, which was the exact number required to lose the House, giving Democrats full control of the state legislature and derailing any agenda GOP Governor Glenn Youngkin may have had. In 2024 Trump reduced his deficit from 10.1% to 5.7%, but his margin of defeat (260,000 votes) was still the second-worst of any GOP candidate in Virginia history, second only to Trump in 2020. Even in percentage terms it was the worst (aside from 2020) of any GOP nominee since Goldwater in '64. False hope extended to the 2024 senatorial campaign of Republican Hung Cao, whose 2022 showing as a House candidate in CD-10 was considered to be impressive. He lost by merely 6.5% that year in a district which was designed to give the Democrat a 10-12 point win. Whoopee again. Many delusionals thought that Cao could keep it close against Timmy Kaine in 2024, but few polls ever had him within single digits. Cao "overachieved" again. He only lost by 9 points. There was no false hope regarding GOP chances in Virginia in 2025; there was no hope at all aside from perhaps the Attorney General race. Polls showed a tossup but it turned out that a majority of Virginia voters agreed with the Democrat candidate on the pertinent topic of slaughtering Republicans and their children. 2025:
Republicans can be thankful for the lack of state Senate contests in NJ and VA in November, 2025; they couldn't lose more seats there if there weren't any elections. 2025 New Jersey gubernatorial results by region:
The above results for the 2025 Governor election are of course still unofficial (data as of 11/10) but are at least 95% complete in most counties. We defined the regions of New Jersey here: November 2025 Gubernatorial Elections -- New Jersey & Virginia. The Republican percentage of the vote collapsed to pre-2021 levels in all regions, even if not quite (in some areas) as bad as the GOP percentages from 2017 . Only in the Central Coast area did Jack Ciattarelli compare favorably at all to his results from 2021. In every other region of the state he finished well behind not only his surprisingly competitive 2021 performance but also behind Trump's mediocre showing in 2024. GOP results in the critical (and supposedly right-trending) northern part of New Jersey were especially disappointing. South Jersey was also a disaster for Ciattarelli. He had come barely one point away from winning that region in 2021 but lost it by a whopping 15 points last week. As we predicted, turnout in the ghetto areas of New Jersey returned to normal from the 2021 dropoff. That certainly wasn't good news for the Republican, but his problems were hardly confined to the worst areas of the state. Also, slightly-improving voter registration figures apparently aren't a guarantee of electoral success -- especially when those voters decline to participate. 
Artist's conception of the GOP's 2018 election results
Back to 2018:
An ongoing story throughout 2018 was the number of Republican incumbents in the House of Representatives who suddenly decided that they would not seek re-election in November. There were 23 Republicans who declined to run again for any office, and 11 other House Republicans who chose to run for a different office. Many of these 34, such as former House Speaker Paul Ryan, were anti-Trump moderates or liberals in marginal districts who were content with the prospect of potentially being replaced by Democrats. When trying to explain the debacle which resulted that November, with the GOP losing 40 House seats, the voluntary exodus was a convenient excuse albeit a false or at least incomplete one. Of the 34 Republicans who walked away in 2018, only 10 of them were replaced by Democrats. That's a considerable number, but a far cry from 40. The far bigger reason for the Republican party demise was the 30 incumbents who ran for re-election and lost. Seven of the total of 40 GOP losses occurred in California, which had just legalized a new form of Democrat electoral chicanery known as "ballot harvesting". That tactic allows ballots to be collected and counted for weeks after election day. Of the 7 Republican seats which evaporated in CA, at least 5 of them required "extra time" for the Democrat to eventually prevail. In 2018 the Real Clear Politics generic congressional polling final averages were GOP 44.9%, Democrat 53.3%. That polling could hardly have been more accurate -- after all the ballots were finally counted, the House vote share was GOP 44.8% (was 49.1% in 2016), Democrat 53.4% (was 48.0% in 2016). In case you're wondering about 2026 at this point, the current RCP congressional polling averages are GOP 42.0%, Democrats 46.1%. There are still lots of undecideds 12 months out from the election, but that 42.0% mark is abysmal. The whistlers past the graveyard now have another data point to ignore if they intend to remain adamant that 2026 can't possibly be as bad as 2018 was. 
Senate results from 2018
The House went up in flames but Election Night 2018 was a good one for Republicans in the Senate. Good, but not great. The 2017 GOP defeat in Alabama had left the Republicans with a narrow 51-49 majority. In 2018 they picked up 4 Senate seats (FL, IN, MO, ND) but also lost a pair of seats which they had previously held (AZ, NV) for a net +2. For a little while there also seemed a possibility of the GOP losing Thad Cochran's seat in Mississippi.
Here, at last, is how the playing field stands as we head into 2026: Before we look at the prospects for the House in 2026, let's quantify what happened in 2018. In 2018 there were 80 districts (out of 435) across the nation which we would classify as marginal -- being in the range of D+5 to R+5. Those 80 are worth examining because they were the districts most likely to change hands. During any kind of "wave" election, as we saw in 2018, obviously more of them will change hands. Districts which are outside the marginal range are normally considered safe unless there is a wave of unusual intensity or there are other circumstances which make an incumbent vulnerable despite the lean of his district. Some facts about those 80 marginal districts in 2018:
Additionally, Republicans lost 8 House seats which were not in the marginal range and were assumed to be at least moderately safe. Six of those 8 districts saw GOP incumbents bite the dust; only 2 were open seats (one more dagger in the feeble "we lawst just coz of all the re-tyre-mints!" argument). The above data illustrates the impact of the 2018 "blue" wave in the House. Even though the 80 marginal districts tilted slightly to the right on average, Republicans still managed to lose 61 of the 80. And on top of that the 8 others which were supposed to be safe-ish. That's what a massacre looks like, so you'll recognize it if you see one again in 2026. As noted, the "marginal playing field" was tilted towards the Republicans in 2018. If the parties had won every tossup district in which they were favored and then split the 10 even districts, Republicans won have won 53 out of those 80 districts instead of just 19 of 80, a difference of 34 seats. Give the GOP 34 more House seats in 2018 (they would've had control, 234-201) and suddenly the second half of Trump's first term looks a lot different. We have looked at all House districts for 2026, factoring in new maps in Texas, Missouri, Ohio, North Carolina and California and we are assuming they are not overturned in court prior to ever being used. Try to look surprised when the partisan Democrat gerrymander in California passes judicial muster but Republican maps elsewhere do not. A new Democrat gerrymander was just approved on November 11 by a liberal judge in heavily-Republican Utah, which creates two more marginal districts (not being counted here yet) and very well could cause two Republicans to lose in 2026. In Utah. Pending upcoming Democrat gerrymanders which are still on the drawing board in states like Virginia, Maryland, Illinois and Colorado, and pending the much-anticipated Supreme Court ruling which may remove the requirement for certain states to create anti-White districts, here is how the House battleground is taking shape for 2026: There are currently 91 House districts which fall into the D+5 to R+5 range according to our ratings. We count 41 of those districts as having GOP incumbents and 41 with Democrat incumbents. The remaining 9 districts have no incumbent running, and that number will increase over the next few months. Including currently open seats, Republicans must defend 45 districts and Democrats 46. That's about as even a breakdown as can be.
The likely effects of the ongoing redistricting currently are:
We will cover the Senate prospects for 2026 in a commentary which will shortly follow this one. Conclusion: With even more re-redistricting to come, forecasting the outcome of the 2026 U.S. House elections from this far out is just a guessing game. Democrat-controlled states including (but not limited to) Virginia, Maryland, Illinois, Colorado and New York are lining up to disenfranchise Republicans further whether the law permits them to do so at this time or not. Maryland has only one GOP congressman left to be exterminated, but those other states can do much more damage. As we've mentioned, even rock-solid Republican Utah is being forced by a liberal black-robed tyrant to hand over 1 or perhaps even 2 House seats to Democrats (Utah only has 4 altogether). Some Republican states, perhaps including Florida, Kansas, Nebraska and Indiana can do unto Democrats as Democrats in other states will be doing unto Republicans. But deep-"red" Indiana has already chickened out, Kansas (like Indiana and Missouri) could gain only 1 seat at most -- they all count, so don't scoff too much -- and the GOP can't gain any in Nebraska but can save one which otherwise is about to go down the toilet. Only in Florida is there the potential for a Republican state to get some "California-style" revenge on Democrats, but they could overextend themselves and wind up worse off than where they started (as could easily occur in North Carolina). The Supreme Court may come to the rescue. Do not hold your breath waiting for that. A case is pending, brought by a group of White voters in Louisiana who are challenging the racist congressional district map which was demanded by a judge and then used for the 2024 House elections. These disenfranchised voters are suing in an attempt to strike down a map which created a second black-majority district in their state. If the USSC rules in favor of the plaintiffs, professional racists are concerned that all racist Democrat gerrymandering everywhere -- which has been "the law" since at least the early 1990s -- will collapse, thereby eliminating several districts ("19" is the magic number they keep quoting) which are currently held by black Democrats, and those Democrats will all be replaced by White Republicans. As a result, the GOP would firm up its control of the House such that no amount of Democrat gerrymanders in California, Virginia, New York, Illinois or wherever can offset. This is utter nonsense. First the case has to actually be decided and the Supreme Court is in no hurry, especially in an election year; it will surely be 2026 before anything happens. Secondly, the court has to decide the right way. Does anyone really expect there to be 5 votes for doing the right thing here? John Roberts can almost certainly be relied upon to do the wrong thing. Again. Then there has to be sufficient time to draw new maps in the affected states. And sufficient time for the immediate Democrat lawsuits to be heard. And then those suits must be rejected so the new maps can be implemented. Good luck with all that. And then things have to work out the way panicky Democrats fear they will. Let's take a look at how the Democrat crystal ball came up with this cockamamie number of "19" seats which they claim are in jeopardy if the USSC disallows racist (i.e. Democrat) gerrymandering in certain southern states. Remember: this stuff was never about race; it was always about partisan politics. Whenever you see the word "black" or "minority" in some racist court ruling, replace that word with "Democrat" if you want to know the truth. As best we can guess from trying to interpret the feverish nightmares of Democrats, here are the Magic 19:
So there you have it: 19 House seats which are currently held by black Democrats. If the recently created maps in MO and NC hold up in court, then the GOP will be +2. If the Supreme Court does the right thing and does it promptly, there is a good chance for Republicans to reclaim the two seats (AL-2, LA-6) which black-robed leftist dictators stole from them in 2024. There will be no further developments in Missouri or North Carolina. That leaves Florida and Georgia as the only hopes for inflicting some damage on the Rats. That's much easier said than done. No matter what lies Democrats are telling about this upcoming court ruling, Republicans will never get anywhere near +19. Doing so would require them to eliminate most or all of the above districts and then create ones which will elect a Republican. And then have those district maps persist despite Democrat lawsuits. That's completely impossible, and Democrats know it. But they never fail to play the race card or the victim card whenever they can, the media swallows that shit up and then regurgitates it for the purpose of bamboozling low-info, low-intelligence voters into voting (D). The fluctuating re-redistricting landscape is making 2026 a unique year for which to forecast House elections, and that will be true until all maps are final. Even ignoring that factor for the moment, there is already substantial evidence to conclude that the 2026 results will mirror the results from 2018; conversely, at this time there is zero evidence (wishful thinking is not "evidence") that the 2026 results will not mimic 2018, at least as far as the general direction those results will take. To what degree that will happen is something that can't be anticipated with any precision yet. It's very possible that Congress in 2027-28 will look very much like the one from 2019-20, with Democrats -- no matter how slender their majority -- marching in lockstep in full control of the House ("Peach Mints are back on the menu immediately!") while disunited Republicans perhaps cling to nominal Senate control with a lame duck in the White House. Tags:
2025
2026 (uh oh)
Virginia
New Jersey
And just about everywhere else
| |||||||||||||||||||||||||||||||||||||||||||||||||||||||||||||||||||||||||||||||||||||||||||||||||||||||||||||||||||||||||||||||||||||||||||||||||||||||||||||||||||||||||||||||||||||||||||||||||||||||||||||||||||||||||||||||||||||||||||||||||||||||||||||||||||||||||||||||||||||||||||||||||||||||||||||||||||||||||||||||||||||||||||||||||||||||||||||||||||||||||||||||||||||||||||||||||||||||||||||||||||||||||||||||||||||||||||||||||||||||||||||||||||||||||||||||||||||||||||||||||||||||||||||||||||||||||||||||||||||||||||||||||||||||||||||||||||||||||||||||||||||||||||||||||||||||||||||||||||||||||||||||||||||||||||||||||||||||||||||||||||||||||||||||||||||||||||||||||||||||||||||||||||||||||||||||||||||||||||||||||||||||||||||||||||||||||||||||||||||||||||||||||||||||||||||||||||||||||||||||||||||||||||||||||||||||||||||||||||||||||||||||||||||||||||||||||||||||||||||||||||||||||||||||||||||||||||||||||||||||||||||||||||||||||||||||||||||||||||||||||||||||||||||||||||||||||||||||||||||||
| 10/24/2025: November 2025 Gubernatorial Elections -- New Jersey & Virginia [RightDataUSA] | |||||||||||||||||||||||||||||||||||||||||||||||||||||||||||||||||||||||||||||||||||||||||||||||||||||||||||||||||||||||||||||||||||||||||||||||||||||||||||||||||||||||||||||||||||||||||||||||||||||||||||||||||||||||||||||||||||||||||||||||||||||||||||||||||||||||||||||||||||||||||||||||||||||||||||||||||||||||||||||||||||||||||||||||||||||||||||||||||||||||||||||||||||||||||||||||||||||||||||||||||||||||||||||||||||||||||||||||||||||||||||||||||||||||||||||||||||||||||||||||||||||||||||||||||||||||||||||||||||||||||||||||||||||||||||||||||||||||||||||||||||||||||||||||||||||||||||||||||||||||||||||||||||||||||||||||||||||||||||||||||||||||||||||||||||||||||||||||||||||||||||||||||||||||||||||||||||||||||||||||||||||||||||||||||||||||||||||||||||||||||||||||||||||||||||||||||||||||||||||||||||||||||||||||||||||||||||||||||||||||||||||||||||||||||||||||||||||||||||||||||||||||||||||||||||||||||||||||||||||||||||||||||||||||||||||||||||||||||||||||||||||||||||||||||||||||||||||||||||||||
Although the elections may be tantalizingly close (in truth, they probably won't be that close), the likeliest outcome for the Republicans is. . .

The races have generally (but not consistently) been tightening in both states, especially according to polling organizations which are classified as Republican-leaning by liberal media sources. Some hardcore leftists (e.g. Washington Post) are cheerleading for a Democrat blowout in Virginia, but the ones who attempt to be less transparently liberal forecast the contests as being moderately competitive. Close though the races may be, as things stand now both Jack Ciattarelli (NJ) and Winsome Earle-Sears (VA) appear to be heading for losses. It's up to the good voters of New Jersey and Virginia to get out and vote and prove the pollsters wrong.
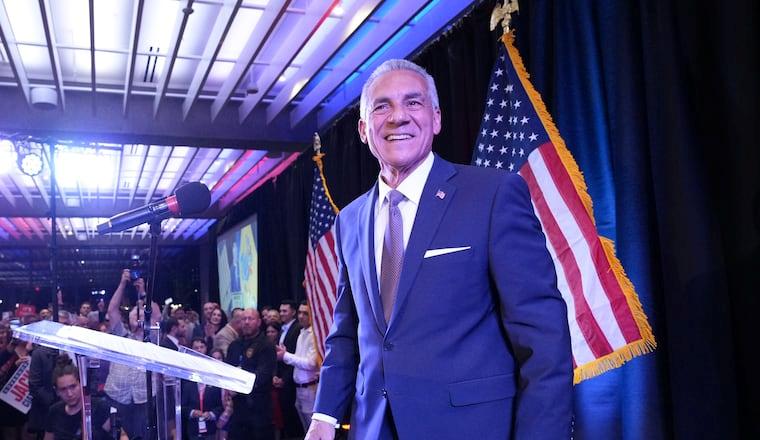
Photo credit: inquirer.com
Background:

Photo credit: app.com
The 2021 election was mainly a referendum on Murphy's first term, with Ciatterelli being regarded as sufficiently bland and moderate to avoid alienating potential crossover Democrat voters which any Jersey Republican requires in order to have a chance of winning a statewide election. Murphy is a huge supporter of the illegal importation of new Democrat voters from foreign countries, and he designated New Jersey as a sanctuary state. He also took several steps to hinder the deportation of illegals, such as not permitting law enforcement to ask about immigration status. By 2021 many New Jersey voters had grown weary of the invasion and their disaffection hurt Murphy's re-election chances. Nor were the voters pleased with the numerous tax increases which were passed by the overwhelmingly Democrat NJ legislature.
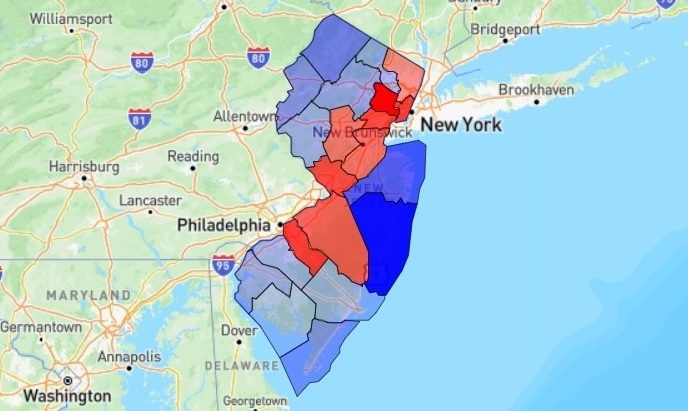
2024 presidential election results in New Jersey
Geography:
West Jersey and the Central Coast are the most Republican areas of the state; together they normally cast 28-30% of the statewide vote. Unsurprisingly, Ghetto Jersey is by far the most Democrat area of the state; it delivers about 18% of the statewide vote and gives a tremendous margin to whatever Rat is running. Of the three recent elections (2017 Governor, 2021 Governor, 2024 President) which we will be focusing on for the purpose of establishing trends, Trump did the best of any GOP candidate in this region, but still received only 32% of the vote. Central Jersey (epitomized by places such as Trenton, New Brunswick and Princeton) is consistent in its anti-Republicanism and provides approximately a 16-point margin for the Democrat while accounting for 16-17% of the statewide vote. South Jersey is the largest region both in land area and in number of votes. It accounts for about 22% of New Jersey's votes and can be marginal. It was heavily against Ciatarelli in 2017 but he nearly won there in 2021 before the region swung back a few points to the left against Trump in 2024. The Urbanized North is the most marginal region now and is the one which is moving most noticeably to the right although still slightly favoring the left. It is this area which GOP analysts see as the key if they are to win in New Jersey. Republicans have recently been competitive in the 9th congressional district which lies almost entirely in this region, despite being grossly outspent and despite a Democrat gerrymander which deliberately omits the better parts of Passaic County. Ciattarelli improved here by 12 points (net) between 2017 and 2021 and Donald Trump nearly won this region, losing by only 1.5% in 2024.
The next table shows the margin of victory (or defeat, if the number is negative) by region for the GOP candidate in these three elections:
Finally, the number of votes cast by region, along with the region's percentage of the statewide vote:
One of the keys to the near-upset in the 2021 gubernatorial election was the fact that many ghetto voters (Democrats, obviously) chose to sit that one out rather than vote for Murphy. The share of the statewide vote from Essex, Hudson and Union counties dropped nearly 2 percent. Those voters were re-energized in 2024 to vote against Trump and the statewide vote share from the 3 ghetto counties rebounded to where it had been in 2017. Anti-Murphy apathy will not be on the ballot in a couple of weeks, but anti-Trump motivation will be -- here and everywhere else where an election is taking place (at least in "blue" areas). As was the case in the disastrous election years of 2017-18, Trump is always "on the ballot" as far as the left is concerned. Turnout in these off-year races isn't quite as meager as it is for little-publicized special elections which often take place at odd times (i.e. not November), but turnout still does not approach presidential-year levels. That means motivation, organization and money are the key factors to generating turnout; Democrats are normally substantially ahead in all 3 of those factors, and it shows. Voter Registration: 
Photo credit: redlineheadlines.com
Scott Presler and his organization have worked diligently over the past couple of years to increase Republican voter registration counts in certain states. Presler focused on Pennsylvania during 2024 and has been given inordinate credit for the GOP victories which occurred there -- Trump's win along with that of Senator Dave McCormick, and the important pickup of two House seats (CD-7 and CD-8) in Eastern PA.
2025:
The last time Republicans achieved a 40.9% or greater share of voter registrations in a November election in PA was 2003. This November, Pennsylvania voters will have the chance to oust 3 Democrat members of the state Supreme Court. Those members, along with their liberal colleagues, are responsible for the hyper-partisan gerrymander which has affected not only congressional districts in Pennsylvania but state legislative districts as well. These gerrymanders cost Republicans 4 U.S. House seats (and almost 2 others) from 2019-2024 and cost 12 state House seats -- exactly enough to give Democrats control. Republicans have a chance to eliminate some of the justices who caused those events to happen, and perhaps gain a majority on the PA Supreme Court in the process. 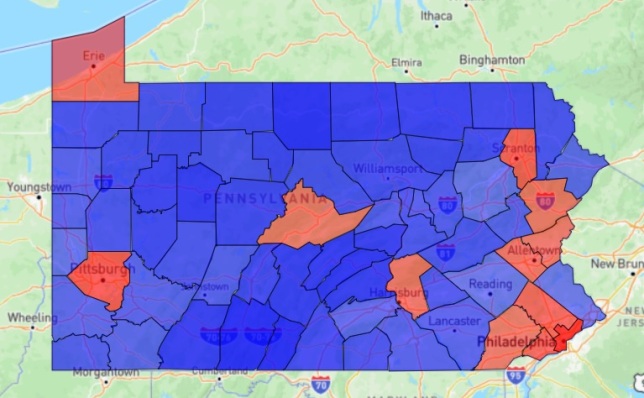
2024 PA voter registration, by county
After 2024, Presler and his vote registrars moved east to New Jersey in an attempt to turn that state "red". As in PA, trends in New Jersey were already favoring Republicans, although these trends have not manifested themselves in any victories. Trump's loss by 5.9% here in 2024 was actually the best showing for a Republican candidate since George Bush lost by only 2.4% in the 3-way election of 1992. Prior to 1992, the GOP won 6 presidential elections in a row in New Jersey before the state's demographics began to head rapidly south.
November 2024:
October 2025:
It is worth noting that a sizable number of New Jersey voters are neither Republicans nor Democrats. If the polls are correct, independents are favoring the Democrat by a substantial amount in the 2025 gubernatorial race. Going back to 2008, Republicans have added 614,894 voters in New Jersey and Democrats have added 742,790. However the recent data is more affirmative with the GOP registering large gains during 2024 and then almost as many again in 2025. Democrat registration has been stagnant during the past two years. Will the "Presler bump" in 2025 be enough to put Ciattarelli over the top on November 4? Current polling suggests it will not. He may be fortunate to lose by only as much as he did in 2021. Conclusion: It is being reported, even by far-left sources, that all is not well in Camp Sherrill despite her clear lead in nearly every poll. There has also been fear that black voters and other minorities will turn out at less than their usual rate, as occurred in 2021 (spoiler alert: that isn't going to happen again in 2025). The Naval Academy cheating scandal in which both Sherrill and her husband are allegedly involved isn't resonating at all with voters and (shockingly!) isn't being covered in the so-called mainstream media. Even lefties concede that Sherrill does not generate much enthusiasm, but the fact that New Jersey has nearly 1 million more Democrats than Republicans makes "enthusiasm" a rather moot point in the face of that landslide registration advantage. Furthermore, while comparatively few Democrat and independent voters may be excited about voting for Mikie Sherrill, they are probably quite motivated to vote against Donald Trump clone Jack Ciattarelli. Of course Ciattarelli is no such thing, but hatred is a powerful motivator for Democrats and no facts are going to be allowed to impede that hatred. Final prediction: Sherrill prevails by 2 to 4 points, with a decent potential for an even greater margin (say, 4-6 points). We'd positively adore being wrong about this outcome, but even if she only wins by 1 then we're still not quite wrong enough. Virginia: 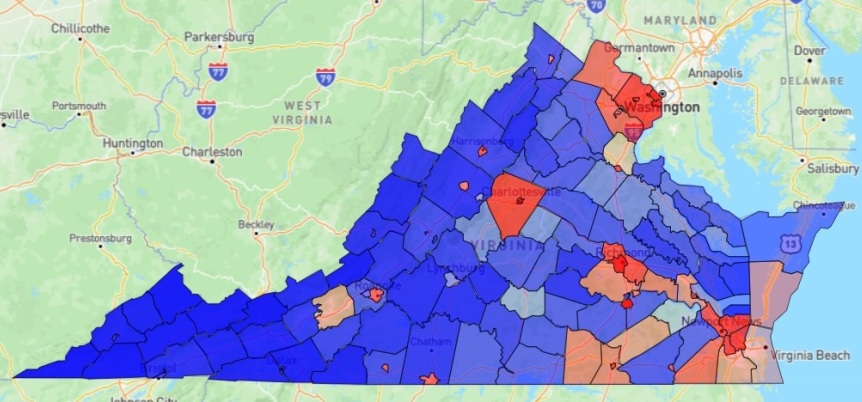
2024 presidential election result in Virginia
Background:
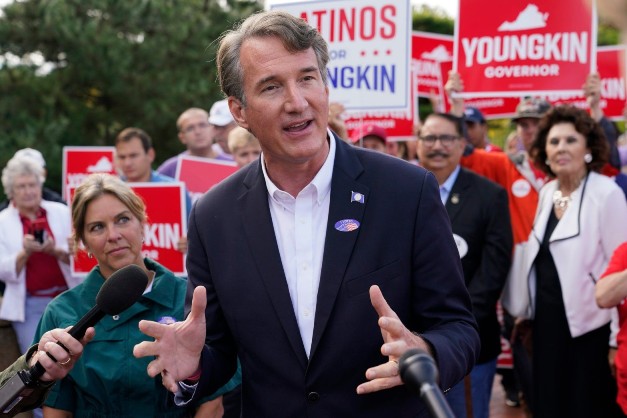
Photo credit: washingtonmonthly.com
The candidates: 
Photo credit: lifenews.com
GOP nominee Winsome Earle-Sears is an immigrant from Jamaica who arrived in the U.S. at the age of 6. She served in the United States Marine Corps for 4 years in the 1980's and became an American citizen during that time. Her political career commenced in the early 2000's when she won a race for the state House, upsetting a black Democrat who had been in office for two decades. She was the first Republican to win a state House seat in a majority-black district in Virginia since 1865. She later became the state's first female Lieutenant Governor (elected in 2021) and is the first black female to be elected to any statewide office in Virginia.

Photo credit: twitchy.com
Spanberger, a native of New Jersey, went from being a substitute schoolteacher and a postal inspector to (as of 2006) being a spy for the Central Intelligence Agency; a rather interesting career change, to say the least. When she first entered politics, Spanberger's CIA resume was sanitized so that it could be declassified and, according to ABC News, the former spook stuck "to carefully scripted lines, approved by the agency, when talking about her work" on the campaign trail.

Photo credit: NRCC
Republicans picked up 13 House seats in 2020 but Spanberger's wasn't one of them although a serious effort was made. Her district, which had been rated as R+10 prior to the 2016 Democrat gerrymander, was still slightly "red" and Republicans had it high on their list of potential pickups. Spanberger, then as now, occasionally talks like a moderate and did cast a highly publicized (and highly choreographed) vote against Nancy Pelosi for Speaker in January, 2019. Spanberger then spent the remainder of her first term in Congress establishing her liberal bona fides, but was able to conceal that fact from the voters as she reverted back to her faux-moderate persona.
Taking some of these regions together, Virginia can be divided into three pieces of approximately equal electoral weight. Two of the three nearly always favor Democrats. NOVA is of course the most Democrat-infested area, teeming with people whose livelihoods depend on the federal The portion of the state which is included in the Piedmont / Southside / Shenandoah / SW Virginia regions accounts for just under 30% of the statewide vote and gives Republicans their biggest margins of any region. The statistically insignificant (barely 2% of the vote), lightly populated Chesapeake Bay counties also support Republicans lately, by almost exactly the same percentages as obtained in the Piedmont / Southside areas. The Greater Richmond and Hampton Roads regions together outnumber NOVA in total voters, though not by a lot. They solidly favor Democrats in most races, and if a Republican is going to win a statewide election he needs to come close to getting 50% here. Youngkin did that in 2021 (he received about 48%) but Ed Gillespie didn't in 2017 nor did Donald Trump or Hung Cao in 2024. The latter 3 GOP candidates mustered only about 42% or 43% there; Youngkin won statewide, the others did not. Conclusion: Unlike in North Carolina in 2024, where the unpopularity of one GOP candidate (Mark Robinson) dragged down the entire statewide Republican ticket although some Republicans won anyway, the presence of violent, feral racist Jay Jones as Democrat nominee for Attorney General has had no impact on other Virginia Democrats in 2025; in fact, Jones still retains about a 50-50 chance of winning himself according to left-wing pollsters. So any Jones Effect on the gubernatorial race which would assist Sears can likely be discounted as non-existent. As of October 15, campaign finance reports showed that CIAbby had raked in $53.8 million and disbursed $48.4 million. The Sears campaign lags far behind, running on about half of what the Democrat has done in both of those categories. There is also a wide disparity between the two candidates in terms of remaining cash-on-hand, with about a 3:1 advantage to Spanberger as we head into the final days of the campaign. The Lieutenant Governor race and the one for Attorney General will end up closer than the Sears-Spanberger duel, but Republicans are likely to lose at least one of those two downballot tilts, and quite possibly both. There is some chance that they could win both (while still losing for Governor), but that is less likely barring a significant change in fortunes between now and November 4. The Virginia state Senate has been in Rat hands since they picked up the two seats they needed in 2019. It's been status quo since then, with the Republicans needing one seat to forge a tie and two to take control. With the L.G. probably going Democrat in 2025, one seat isn't going to be enough. The state Senate map for this decade has been gerrymandered to favor Democrats, and under those conditions the GOP is doing well to merely be down 21-19. A similarly gerrymandered state House map also strongly favors Democrats; again, the GOP has done well to even keep it close. The forecast for this November is not sunny for Virginia Republicans at the state legislative level, and they are going to need to overachieve a little more if there is any hope of thwarting the agenda of "Governor Spanberger". Ugh. Tags:
2025
Governor
New Jersey
Virginia
| |||||||||||||||||||||||||||||||||||||||||||||||||||||||||||||||||||||||||||||||||||||||||||||||||||||||||||||||||||||||||||||||||||||||||||||||||||||||||||||||||||||||||||||||||||||||||||||||||||||||||||||||||||||||||||||||||||||||||||||||||||||||||||||||||||||||||||||||||||||||||||||||||||||||||||||||||||||||||||||||||||||||||||||||||||||||||||||||||||||||||||||||||||||||||||||||||||||||||||||||||||||||||||||||||||||||||||||||||||||||||||||||||||||||||||||||||||||||||||||||||||||||||||||||||||||||||||||||||||||||||||||||||||||||||||||||||||||||||||||||||||||||||||||||||||||||||||||||||||||||||||||||||||||||||||||||||||||||||||||||||||||||||||||||||||||||||||||||||||||||||||||||||||||||||||||||||||||||||||||||||||||||||||||||||||||||||||||||||||||||||||||||||||||||||||||||||||||||||||||||||||||||||||||||||||||||||||||||||||||||||||||||||||||||||||||||||||||||||||||||||||||||||||||||||||||||||||||||||||||||||||||||||||||||||||||||||||||||||||||||||||||||||||||||||||||||||||||||||||||||
| 7/2/2025: Today's Breakfast Specials: Fried Bacon, Toasted Tillis [RightDataUSA] | |||||||||||||||||||||||||||||||||||||||||||||||||||||||||||||||||||||||||||||||||||||||||||||||||||||||||||||||||||||||||||||||||||||||||||||||||||||||||||||||||||||||||||||||||||||||||||||||||||||||||||||||||||||||||||||||||||||||||||||||||||||||||||||||||||||||||||||||||||||||||||||||||||||||||||||||||||||||||||||||||||||||||||||||||||||||||||||||||||||||||||||||||||||||||||||||||||||||||||||||||||||||||||||||||||||||||||||||||||||||||||||||||||||||||||||||||||||||||||||||||||||||||||||||||||||||||||||||||||||||||||||||||||||||||||||||||||||||||||||||||||||||||||||||||||||||||||||||||||||||||||||||||||||||||||||||||||||||||||||||||||||||||||||||||||||||||||||||||||||||||||||||||||||||||||||||||||||||||||||||||||||||||||||||||||||||||||||||||||||||||||||||||||||||||||||||||||||||||||||||||||||||||||||||||||||||||||||||||||||||||||||||||||||||||||||||||||||||||||||||||||||||||||||||||||||||||||||||||||||||||||||||||||||||||||||||||||||||||||||||||||||||||||||||||||||||||||||||||||||||
Over the past few days, two moderate Republicans have announced that they will not be seeking re-election in 2026: Rep. Don Bacon of Nebraska and Senator Thom Tillis of North Carolina. Both of these anti-conservative politicos have taken great pride in being a thorn in the side of the majority of their party, and they bask in the positive media attention they get when they oppose President Trump.

Photo credit: AP Photo/J. Scott Applewhite
Although he did not make the official announcement until June 30, there had already been chatter that Bacon was through after this term. He was first elected alongside future nemesis Donald Trump in 2016, defeating erratic Democrat incumbent Brad Ashford by 1.2%. Ashford started out as a Democrat, switched to Republican, then became an Independent, then back to Democrat again. He used his scattershot background to provide cover for his natural liberalism; although Ashford campaigned as a moderate he nearly always voted as a liberal during his lone term in Congress.
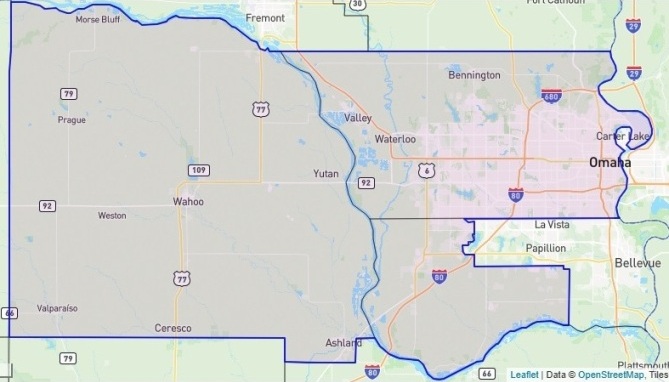
Nebraska congressional district 2
Nebraska's Second Congressional District contains all of Omaha, and the city comprises 75% of the district. It is the other 25% which (so far) has kept this a Republican seat in the House. By 2024, the White percentage of the district was down to approximately 65% (it had been 80% as of the early 2000s) while the Hispanic percentage continues to rapidly increase. This district -- which awards its own Electoral Vote in presidential elections -- not only has rejected Trump twice in a row now, it also voted heavily against incumbent Republican Senator Deb Fischer in 2024, preferring "independent" Dan Osborn by a whopping 12 points. NE-2 did vote Republican for Governor in 2022 and for the other Senate seat (Ricketts) in 2024, however it was by the narrowest of margins. Led by Omaha, the district is obviously trending leftward and is now rated as D+2. Even as recently as 2020 it was rated as leaning to the right by a miniscule amount, but those days are gone.
John Gizzi -- who at one time was a respected political analyst for the conservative publication Human Events but now in his dotage regularly reveals himself to be a member in good standing of the GOP establishment -- crafted an article for Newsmax on June 26 which correctly anticipated Bacon's departure. That article contains a couple of errors however, one of which is a hilarious whopper but quite appropriate for an establishment RINO to make. 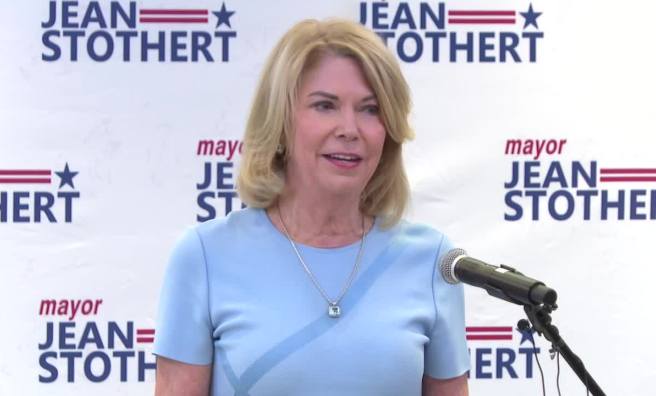
Photo credit: 3newsnow.com
Minor error #1: former Omaha Mayor and nominal Republican Jean Stothert (elected in 2013, 2017 and 2021) is not a transvestite and therefore is not a "he" as a quote from the article states; a minor error but one which reveals a certain amount of cluelessness on the part of the quoter, who was a former chairman of the Nebraska Republican party. That guy did get one thing right -- Stothert is surely no conservative. Stothert had her easiest election in 2021 when three liberal Democrats split the primary vote and could not reunite in time for the general election one month later. Stothert lost in May of 2025 by almost 13 points to a liberal black Democrat, conclusive evidence of how the city of Omaha has finally completed its journey to the dark side. Even granting that Stothert's general election campaign in 2025 was sabotaged by Republican primary loser Mike McDonnell (who spitefully endorsed the Democrat), it seems that even moderate Republicans no longer need apply for electoral employment within the city limits.
Toasted Tillis: 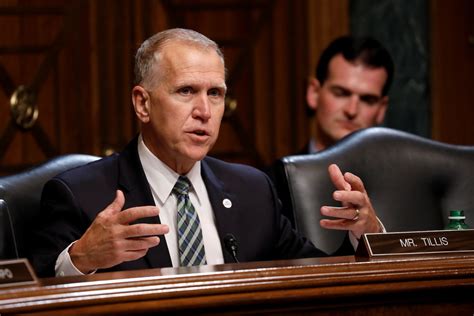
Photo credit: Washington Post
Business executive Thom Tillis was elected to the North Carolina state House in 2006 after one term as a city commissioner. Tillis compiled a conservative voting record (but was a more bipartisan type aside from some of his positions on key votes) during his 4 terms, and was Speaker of the NC House from 2011 through the end of his tenure there. True conservatives very rarely ascend to the position of Speaker even in the most conservative of states, and North Carolina isn't one of those anyway.
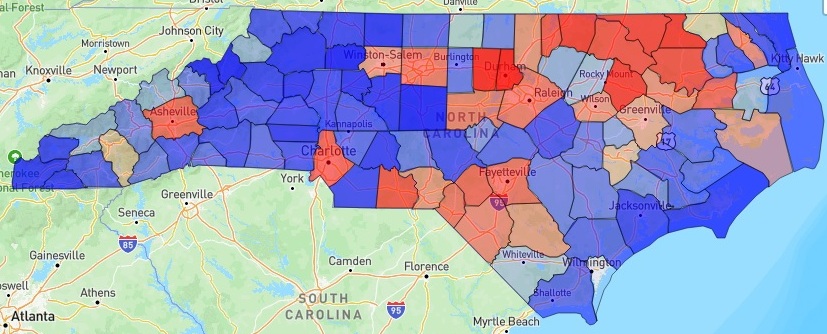
North Carolina Senate election results, 2014
Tillis carefully walked a line down the middle of the road during his first two Senate years (2015-2016) which corresponded with the final two years of the Obama administration. Desperately seeking to project an image of moderation in his sharply divided state, Tillis supported Obama somewhat more often than he opposed the president on Senate votes. Tillis was a staunch (though not entirely reliable) supporter of Donald Trump during Trump's first term in office.

Romney and Tillis: Birds of a Feather Photo credit: newsmax.com
With Trump safely out of the picture now, Tillis emerged as even more moderate (actually, liberal) than he had been in the past; his support for the Biden administration's policies and his opposition to conservative principles were both running in the 40% range from 2021-2024; that's Mitt Romney territory, though not quite as reprehensible as Susan Collins or Lisa Murkowski.
NC Senate outlook for 2026: So-called experts have designated the 2026 Senate election in North Carolina as a tossup, but anyone with multiple functioning brain cells would forecast exactly the same thing. No expertise is necessary to see that we are likely heading for another super-close statewide election in a state which specializes in such results. Hopium addicts on the right insist that North Carolina is a solid "red" state, but it is nothing of the sort even though it has voted Republican for president 11 of the last 12 times. The last 5 presidential elections in North Carolina have been decided by an average of just 2.1%. The margin of victory in recent elections for Governor or Senator averages somewhere in the 5-6 point range. The outcomes of statewide row-office elections are even closer, with only two opposed candidates getting even 55% of the vote (and then just barely) in the past 13 years, covering a total of 35 elections. The 2026 Senate race was a tossup from the beginning, whether Tillis ran or not. The top Democrat contender is obviously former Governor Roy Cooper, who should be announcing his entry into the race any minute now. Cooper's average percentage in his two elections for Governor was barely 50%, yet he comes in as the favorite to be the next Senator from North Carolina. His token opposition in the Democrat primary would be one-term former congressman Wiley Nickel, a liberal carpetbagger who spent his life in California and Washington DC before migrating to North Carolina a few years ago. He won a close House race in 2022, but when the Democrat gerrymander of North Carolina's district lines was rightfully invalidated by the state Supreme Court, Nickel found himself in a no-win situation and failed to seek re-election in 2024. 
Photo credit: Carolina Journal
The Republican side is wide open. Lara Trump, chairman of the Republican National Committee for a little over 10 months in 2024-25 (and the daughter-in-law of President Trump) is the heavy favorite for the GOP nomination if she chooses to seek it. A native of the Tarheel State, Trump will still face allegations of carpetbaggery because she has spent much of her adult life elsewhere.
Summary: The seat is probably Cooper's if he wants it. Despite Cooper's reputation as a moderate, the dominant liberal wing of the Democrat establishment will be 100% behind him (they don't really have anyone else here) and Cooper will most likely have at least twice the amount of money to work with as the GOP candidate; the difference will be well into the tens of millions. Wiley Nickel won't even be a dime's worth of a threat to Cooper in a Rat primary, but the Republicans need to avoid a contentious primary as much as possible and then fully unite behind the winner. Otherwise, defeat in November is practically guaranteed. Can a true conservative like Bishop or Harrigan (or Trump?) win a Senate race in North Carolina? Will we get to find out? Given the fact that the media will doggedly defend Cooper and his position as a so-called moderate, and will officially assign whoever the Republican nominee is to the "far right", we may as well go with a winner who would make us proud if he/she makes it to the Senate. As opposed to enduring another Thom Tillis. If Cooper really is the moderate he claims to be (spoiler alert: he's not) then his voting record in the Senate wouldn't be a whole lot different than Tillis' was. He may even be allowed to have carefully-controlled moments of dissent from party orthodoxy, a la John Fetterman, a/k/a "The Last Sane Democrat" in Congress. Of course we'd prefer a Tillis clone to that, but the GOP has its work cut out for it to ensure that "Senator Roy Cooper" doesn't become a reality. Cooper may surprise us all and choose not to run, but he will be (and already is) facing tremendous pressure to toss his hat into the ring. Tags:
U.S. House
Senate
2026
Nebraska
North Carolina
| |||||||||||||||||||||||||||||||||||||||||||||||||||||||||||||||||||||||||||||||||||||||||||||||||||||||||||||||||||||||||||||||||||||||||||||||||||||||||||||||||||||||||||||||||||||||||||||||||||||||||||||||||||||||||||||||||||||||||||||||||||||||||||||||||||||||||||||||||||||||||||||||||||||||||||||||||||||||||||||||||||||||||||||||||||||||||||||||||||||||||||||||||||||||||||||||||||||||||||||||||||||||||||||||||||||||||||||||||||||||||||||||||||||||||||||||||||||||||||||||||||||||||||||||||||||||||||||||||||||||||||||||||||||||||||||||||||||||||||||||||||||||||||||||||||||||||||||||||||||||||||||||||||||||||||||||||||||||||||||||||||||||||||||||||||||||||||||||||||||||||||||||||||||||||||||||||||||||||||||||||||||||||||||||||||||||||||||||||||||||||||||||||||||||||||||||||||||||||||||||||||||||||||||||||||||||||||||||||||||||||||||||||||||||||||||||||||||||||||||||||||||||||||||||||||||||||||||||||||||||||||||||||||||||||||||||||||||||||||||||||||||||||||||||||||||||||||||||||||||||
| 6/29/2025: How Conservative is Your House Rep? A Comparison of CPAC Ratings and RightDataUSA.com Ratings [RightDataUSA] | |||||||||||||||||||||||||||||||||||||||||||||||||||||||||||||||||||||||||||||||||||||||||||||||||||||||||||||||||||||||||||||||||||||||||||||||||||||||||||||||||||||||||||||||||||||||||||||||||||||||||||||||||||||||||||||||||||||||||||||||||||||||||||||||||||||||||||||||||||||||||||||||||||||||||||||||||||||||||||||||||||||||||||||||||||||||||||||||||||||||||||||||||||||||||||||||||||||||||||||||||||||||||||||||||||||||||||||||||||||||||||||||||||||||||||||||||||||||||||||||||||||||||||||||||||||||||||||||||||||||||||||||||||||||||||||||||||||||||||||||||||||||||||||||||||||||||||||||||||||||||||||||||||||||||||||||||||||||||||||||||||||||||||||||||||||||||||||||||||||||||||||||||||||||||||||||||||||||||||||||||||||||||||||||||||||||||||||||||||||||||||||||||||||||||||||||||||||||||||||||||||||||||||||||||||||||||||||||||||||||||||||||||||||||||||||||||||||||||||||||||||||||||||||||||||||||||||||||||||||||||||||||||||||||||||||||||||||||||||||||||||||||||||||||||||||||||||||||||||||||

Photo credit: CPAC.org
There is more to a congressman than his voting record -- there is his role in sponsoring or facilitating legislation; his role in various committees and subcommittees; providing services for his constituents, and other duties. Only the voting record provides a significant amount of quantifiable data about where he stands on the important issues of the day. Congress takes numerous votes over the course of a year. Many votes are not even officially tabulated -- these are "voice votes" -- but others ("roll-call votes") require an explicit enumeration of the Yeas and Nays.
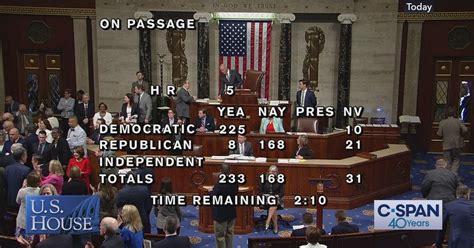
Photo credit: c-span.org
At RightDataUSA.com, we have a complete record of CPAC/ACU key votes and their results going all the way back to 1970, which is when the ACU began issuing ratings. We have also created our own ratings, based on likely ACU criteria, for the years 1961-1969 for those who are interested in ancient history.
While updating the pages of all 2024 House members to reflect the recently-released CPAC figures, we noticed that in many cases their ratings deviated from our own ratings by a substantial amount. The table below displays data for each congressman -- the CPAC rating, the RightDataUSA rating and the aggregate rating (a combination of CPAC ratings and ours). Right at the top of the chart is one good example of this divergence: Alaska representative Mary Peltola, a Democrat who was defeated for re-election last November, was assigned a 53% conservative rating by us for 2024 but only 22% by CPAC. Peltola, as a Democrat from a supposedly solid "red" state, was forced to masquerade as a moderate in order to have any chance of returning to the House for a second term; she came close but lost by 2.4%. How conservative was she, really? Note that even 22% is a very high conservative rating for a Democrat these days and 53% is stratospheric. In the event of a major difference between our rating and CPAC's rating, the truth typically lies somewhere in between. Peltola's aggregate rating was 40% for 2024.
For 2024: The average GOP representative received a rating of 79% from CPAC and 91% from RightDataUSA. The average Democrat representative received a rating of 2% from CPAC and 9% from RightDataUSA. The average House member received a rating of 41% from CPAC and 50% from RightDataUSA. Why are the two sets of 2024 House ratings so different in many instances? Our evaluations skew to the right as compared to those of CPAC. Of the 441 representatives who participated in House votes in 2024, we assigned a higher conservative rating than CPAC to 353 of them; we assigned a lower rating to only 51 (37 received identical ratings from both sources). Even though RightDataUSA and CPAC are approaching this subject from the same conservative perspective, there was surprisingly little agreement on what constituted a key vote in 2024. Between the 23 votes CPAC selected and the 39 we selected, there were only two which overlapped. Furthermore, there was a considerable differentiation in the type of key vote which was selected. Each key vote can be assigned to one of the following categories:
Many key votes could easily be assigned to multiple categories (e.g. practically every vote has some economic component to it), however we limited all votes to a single classification. As one example, all key votes dealing with border control and/or illegal immigration are classified as Social rather than Foreign because it is much more of a social issue than one of foreign policy; but illegal immigration, like so many other vote topics, has a compelling economic impact as well. CPAC's 23 key votes break down as:
Our 39 key votes were distributed as:
Once CPAC ratings are available for a particular year, we allow them to supersede our own ratings and therefore we display the CPAC data and remove ours (we may update the site to show both datasets shortly). Here is a listing of the 39 key House votes we selected for 2024:
Is there any doubt that these votes were on issues which should be of great importance to conservatives? Why did CPAC omit 37 of these 39 votes? Are economic issues -- which they strongly lean towards -- really that much more important than other issues? Was there a desire by CPAC to choose a set of votes which would yield ratings that match their subjective evaluations of certain representatives? Or are we at RightDataUSA overemphasizing social issues and neglecting economics? It should be apparent that the dual sets of votes were selected independently of each other -- during 2024 we had no idea which votes CPAC was considering and (unless they actually visit this site) they had no idea which votes we deemed to be critical. In 2025 the pattern is similar. There are no CPAC ratings to compare to yet, and there probably won't be any until well into 2026. However our 2025 ratings of House members bear a strong resemblance to the ones we generated during 2024, in the sense of being noticeably to the right of what some folks might consider to be accurate. So far in 2025 we have selected 20 House votes as being key ones. Republicans are for the most part so thoroughly united that nearly all of them score at about 90% -- and it would be closer to 100% if we reversed our position (which corresponds to CPAC's position) on the abominations known as Continuing Resolutions (CRs). These resolutions are a cowardly way for Congress to avoid passing an actual budget, thus allowing government spending, the burden on taxpayers and the national debt to continue to spiral out of control because -- so the politicians claim -- the only alternative is the dreaded Government Shutdown. All Republican politicians live in mortal fear of that, since the Democrat Propaganda Machine known as "the media" will ensure that blame is placed solely on one side of the aisle in the event of a so-called shutdown. CPAC always opposes CRs, and so do we. The pair of CRs among our key votes in 2025 are the only ones in which Republicans as a group get a failing grade because they voted in favor; opposition Democrats therefore get a passing grade for opposing CRs, however ludicrous it may be that a majority of Democrats are assigned to the "right" side on anything. If Republicans have majorities in the House and Senate (which they do) and if they are so united (which nearly all of them are) then why are those majorities not accomplishing more? Clearly it's because those majorities are so extremely narrow. The GOP has some ornery contrarians (like Rand Paul and Thomas Massie), grandstanding war-mongering pricks (like Lindsey Graham) and outright Democrats posing as Republicans (like Susan Collins and Lisa Murkowski). When only one or two votes are needed to thwart legislation, these people and others who occasionally behave like them rise to the occasion and become the liberal media's Queen For A Day. Other times, principled conservatives may refuse to be whipped into line on a particular piece of legislation because they will not concede that it is 15% good while being "only" 85% terrible, and the rebels may temporarily receive Strange New Respect from the media as a reward (a reward full of ulterior motives) for derailing something the media objects to. Summary: It's a good idea to be able to evaluate congressmen to determine whether their performance in Congress is in line with the voters of their districts. Several organizations attempt do that, although most such organizations are ones which obsess over a single issue; therefore their ratings appeal only to voters who share that same obsession. A few organizations, including RightDataUSA.com, evaluate members of Congress over a wider range of issues that is based on a larger sample of votes. However, even groups who are on the same side of the political aisle can disagree about the level of liberalism or conservatism that is expressed via a sample of a congressman's votes. Here we have presented our ratings alongside those from CPAC, and readers can decide for themselves which ones to accept. As we get closer to the 2026 midterms, these evaluations will take on greater significance and we will update our ratings as we did here in 2024. Urban Democrat congressmen must always guard their left flanks in primary elections lest a younger and more aggressive and hate-filled ultra-liberal challenge them. In other districts, Democrats are well aware that "moderation" (fraudulent though it is) is a sensible thing. In both types of districts, the degree to which incumbents are concerned with their re-election chances will be reflected in their votes. On the Republican side, the GOP establishment is never interested in having more aggressive conservatives in Congress, and will help squishy incumbents with financing and by creating "paper conservatives" when necessary, to flood the primary ballot and split the right-wing vote. Even with all that GOPe assistance, supposedly vulnerable left-wing Republican incumbents normally run to the left as elections approach, and that will be apparent in their vote ratings too. To make an educated choice, particularly in a primary election, smart voters will want to know everything they can about the person they are voting for -- or against. Tags: | |||||||||||||||||||||||||||||||||||||||||||||||||||||||||||||||||||||||||||||||||||||||||||||||||||||||||||||||||||||||||||||||||||||||||||||||||||||||||||||||||||||||||||||||||||||||||||||||||||||||||||||||||||||||||||||||||||||||||||||||||||||||||||||||||||||||||||||||||||||||||||||||||||||||||||||||||||||||||||||||||||||||||||||||||||||||||||||||||||||||||||||||||||||||||||||||||||||||||||||||||||||||||||||||||||||||||||||||||||||||||||||||||||||||||||||||||||||||||||||||||||||||||||||||||||||||||||||||||||||||||||||||||||||||||||||||||||||||||||||||||||||||||||||||||||||||||||||||||||||||||||||||||||||||||||||||||||||||||||||||||||||||||||||||||||||||||||||||||||||||||||||||||||||||||||||||||||||||||||||||||||||||||||||||||||||||||||||||||||||||||||||||||||||||||||||||||||||||||||||||||||||||||||||||||||||||||||||||||||||||||||||||||||||||||||||||||||||||||||||||||||||||||||||||||||||||||||||||||||||||||||||||||||||||||||||||||||||||||||||||||||||||||||||||||||||||||||||||||||||||
| 4/15/2025: U.S. House District Analysis -- What Are "PVIs"? [RightDataUSA] | |||||||||||||||||||||||||||||||||||||||||||||||||||||||||||||||||||||||||||||||||||||||||||||||||||||||||||||||||||||||||||||||||||||||||||||||||||||||||||||||||||||||||||||||||||||||||||||||||||||||||||||||||||||||||||||||||||||||||||||||||||||||||||||||||||||||||||||||||||||||||||||||||||||||||||||||||||||||||||||||||||||||||||||||||||||||||||||||||||||||||||||||||||||||||||||||||||||||||||||||||||||||||||||||||||||||||||||||||||||||||||||||||||||||||||||||||||||||||||||||||||||||||||||||||||||||||||||||||||||||||||||||||||||||||||||||||||||||||||||||||||||||||||||||||||||||||||||||||||||||||||||||||||||||||||||||||||||||||||||||||||||||||||||||||||||||||||||||||||||||||||||||||||||||||||||||||||||||||||||||||||||||||||||||||||||||||||||||||||||||||||||||||||||||||||||||||||||||||||||||||||||||||||||||||||||||||||||||||||||||||||||||||||||||||||||||||||||||||||||||||||||||||||||||||||||||||||||||||||||||||||||||||||||||||||||||||||||||||||||||||||||||||||||||||||||||||||||||||||||||

Not all House districts are created equally, in partisan terms. Some are designed to elect Democrats, some are designed to elect Republicans, and a comparatively small handful could go either way. When U.S. House elections roll around, as a couple of special ones did in Florida earlier this month, there is a desire to quantify districts so that people can anticipate the outcomes. Does Candidate A have any chance at all against Candidate B? How close should the race be? Could there plausibly be an upset?
On April 1, Republican Jimmy Patronis won the special election in FL-1 by a margin of 14.6%; Republican Randy Fine won the special election in FL-6 by 14.0%. [The left-wing article had the FL-6 number wrong; it should have been R+14 and not R+7. You'd think they would want to be especially accurate here, in order to make their party's "moral victory" not appear to be such a small one.] So what is all this "R+" stuff? It's nomenclature created by political analyst Charlie Cook, for the purpose of evaluating House districts; Cook claims to have published the first such data in the late 1990s. His evaluations, which are known as PVIs, are considered to be the gold standard for district ratings. When you see how they are created, you may find yourself wondering why they hold such a lofty status. From Cook's website: "The Cook Partisan Voter Index measures how partisan a district or a state is compared to the nation as a whole. A Cook PVI score of D+2, for example, means that district performed an average of two points more Democratic than the nation did as a whole, while an R+4 means the district performed four points more Republican." These ratings are not merely measures of past performance; they are also imbued with predictive value and are used to answer questions about future elections in House districts, questions such as the ones in the opening paragraph of this commentary. A slightly more detailed explanation of the calculation comes from Wikipedia: "The [PVI] looks at how every congressional district voted in the past two presidential elections combined and compares it to the national average. The Cook PVI is displayed as a letter, a plus sign, and a number, with the letter indicating the party that outperformed in the district and the number showing how many percentage points above the national average it received." We emphasized part of that last sentence because the vast majority of people who throw around PVIs are clueless about the actual meaning of the numbers, and misinterpret them entirely. This misinterpretation is not of tremendous import as long as the numbers are merely being compared to each other, which after all is their primary purpose. In the above example FL-1 is obviously a more Republican-leaning district than FL-6. Even those who are mathematically-challenged are capable of understanding that 22 is a larger number than 7 (or even 14), though they have no idea -- or the wrong idea -- of what the "22" means or how that number was calculated. 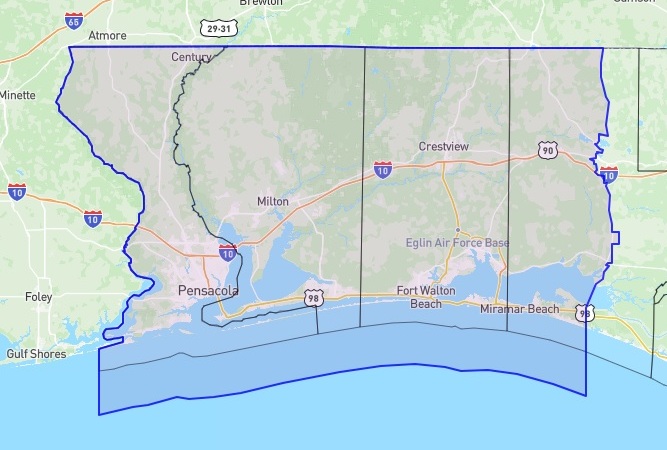
Florida congressional district 1
Let us illustrate. Both Republicans on April 1st won easily in their respective Florida special elections, however given the lean of their districts they appear to have underachieved. This enabled the media and other Democrats to claim hollow "moral" victories in the wake of Democrat defeats, because the GOP candidates did not obliterate their liberal rivals by as much as they were supposed to.

Florida congressional district 6
Randy Fine won FL-6 (PVI of R+14) by exactly 14 points, which sounds like a precisely typical result there. But R+14 does not mean the Republican should win by 14%; it means the Republican should win by 28%. So yeah, another "moral defeat" (LOL) for the GOP. Once again, this outcome is not a harbinger of future performance. In November of 2026 the GOP will win that district every bit as easily as it usually does, and Democrats will not be pissing $10 million of billionaires' money down the drain as they did a few weeks ago, no matter how easily they can afford to do so.
The Cook Political Report (CPR) has lately decided to charge a fee for up-to-date district ratings, which is a shame (for those who actually fork over cash) because their ratings are based on very limited data, and that data contains an overwhelming bias in the logical sense as opposed to the partisan sense. Anyone who has the time, the ability, and the underlying data can calculate PVIs that are not only free of charge, but which are more accurate if based on a wider range of relevant data. The Cook Political Report's current bias can be summarized as "All Republican candidates are Donald Trump". Does that sound like a good assumption to make? Democrat campaign coordinators and their media allies surely agree with Cook, but sensible folks would dispute his assertion. The CPR looks at two -- just two -- points of data for every congressional district in the country, and then anoints the districts with their sacred ratings based on that meager amount of data. The two data points are these, currently:
Astute observers will notice that the one and only Republican in this sample is Donald J. Trump. Thus, Cook is determining district ratings based solely on how much that district voted for or against President Trump. Does an affinity or a hatred for Trump all by itself determine exactly how other Republican candidates -- the ones in U.S. House races -- will fare in their specific districts? What kind of idiot would assume that it does? Below we provide the RightDataUSA.com PVI ratings, without any fee, for every U.S. House district in the country. Our ratings are likely to be similar but hardly identical to the "official" Cook PVIs (we don't know and we aren't paying to find out), because our ratings are based not only on the last two presidential elections but also on many other recent statewide elections. In the table, the "2024 Result" is the percentage which the victorious House candidate received in the November, 2024 election. 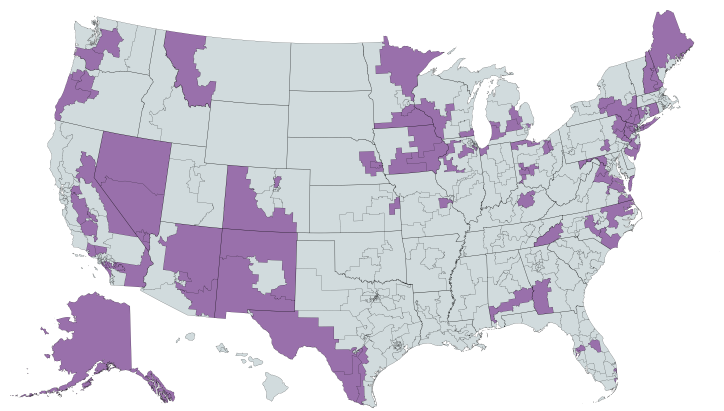
Map of 2026 battleground districts, created using mapchart.net
First, a note about the most competitive districts: Battleground districts are highlighted in the map above and in the table of all House districts which appears further down this page. It is unusual for a House member to win election in a district which tilts 6 points or more towards the opposite party although it does occasionally happen, so we define a "battleground" district as one in the range from D+5 through R+5. When upsets occur in House elections, they normally take place in these marginal districts, and therefore aren't truly "upsets".
In three cases above (CO-08, MI-07 and PA-07) the district is currently held by the "wrong" party -- the one which voters normally do not favor in statewide elections. You can bet that these three, plus other similar districts, are the ones which the national parties will have at the very top of their target lists in 2026. Those other similar districts are:
Based on the above lists, there is much more low-hanging fruit for Democrats to pick off in 2026 than there is for Republicans. Not to mention the two Republicans in already-marginal districts (Brian Steil, Derrick Van Orden) who are destined for extinction by the upcoming court-ordered Democrat gerrymander in Wisconsin. These are not the only districts which have a chance of flipping in 2026. In order to maintain control of the House, Republicans will need to hold on to a significant majority of their most vulnerable seats and perhaps achieve a small number of pickups of Democrat-held seats. They narrowly succeeded in 2024, but it will be more difficult in '26.
Update: Either we caught them on a good day or they've decided to drop the paywall for some reason, but the 2025 Cook PVI ratings are currently available even for non-subscribers! We still believe that more data means greater precision, but now readers can compare the two sets of ratings and decide for themselves. Tags:
PVI
Charlie Cook
U.S. House Ratings
More Data = More Accuracy
| |||||||||||||||||||||||||||||||||||||||||||||||||||||||||||||||||||||||||||||||||||||||||||||||||||||||||||||||||||||||||||||||||||||||||||||||||||||||||||||||||||||||||||||||||||||||||||||||||||||||||||||||||||||||||||||||||||||||||||||||||||||||||||||||||||||||||||||||||||||||||||||||||||||||||||||||||||||||||||||||||||||||||||||||||||||||||||||||||||||||||||||||||||||||||||||||||||||||||||||||||||||||||||||||||||||||||||||||||||||||||||||||||||||||||||||||||||||||||||||||||||||||||||||||||||||||||||||||||||||||||||||||||||||||||||||||||||||||||||||||||||||||||||||||||||||||||||||||||||||||||||||||||||||||||||||||||||||||||||||||||||||||||||||||||||||||||||||||||||||||||||||||||||||||||||||||||||||||||||||||||||||||||||||||||||||||||||||||||||||||||||||||||||||||||||||||||||||||||||||||||||||||||||||||||||||||||||||||||||||||||||||||||||||||||||||||||||||||||||||||||||||||||||||||||||||||||||||||||||||||||||||||||||||||||||||||||||||||||||||||||||||||||||||||||||||||||||||||||||||||
| 1/11/2025: 2024 Special Elections: Not So "Special" for Democrats After All [RightDataUSA] | |||||||||||||||||||||||||||||||||||||||||||||||||||||||||||||||||||||||||||||||||||||||||||||||||||||||||||||||||||||||||||||||||||||||||||||||||||||||||||||||||||||||||||||||||||||||||||||||||||||||||||||||||||||||||||||||||||||||||||||||||||||||||||||||||||||||||||||||||||||||||||||||||||||||||||||||||||||||||||||||||||||||||||||||||||||||||||||||||||||||||||||||||||||||||||||||||||||||||||||||||||||||||||||||||||||||||||||||||||||||||||||||||||||||||||||||||||||||||||||||||||||||||||||||||||||||||||||||||||||||||||||||||||||||||||||||||||||||||||||||||||||||||||||||||||||||||||||||||||||||||||||||||||||||||||||||||||||||||||||||||||||||||||||||||||||||||||||||||||||||||||||||||||||||||||||||||||||||||||||||||||||||||||||||||||||||||||||||||||||||||||||||||||||||||||||||||||||||||||||||||||||||||||||||||||||||||||||||||||||||||||||||||||||||||||||||||||||||||||||||||||||||||||||||||||||||||||||||||||||||||||||||||||||||||||||||||||||||||||||||||||||||||||||||||||||||||||||||||||||||
Prior to November in 2024 there was considerable wailing and pearl-clutching on the right (and gloating on the left) over the underperformance -- if not worse -- of Republican candidates in special elections at the congressional and state levels. 
Photo credit: abc7ny.com
It's true that Democrats did win the most important special election of them all. That took place in February in New York's 3rd congressional district, where ex-incumbent Thomas Suozzi (D) easily defeated newcomer Masi Melesa Pilip (R) in that D-leaning district. The election was held in order to select a replacement for freshman Republican George Santos, who was expelled from Congress in December, 2023. The impetus to oust Santos came not so much from Democrats, but mainly from Santos' own party and particularly his fellow Republican freshmen in the New York delegation. Those frightened frosh were fearful of Santos dragging them down with him in November, so they pre-emptively removed him and thought they had solved their problem.

Photo credit: desposito.house.gov
They sure were, exactly as we predicted. In CD-22 Williams was victimized by a Democrat gerrymander which removed good areas of his marginal district and replaced them with bad ones; it didn't require a major change to the lines, just a little push further to the left was sufficient. In September, anti-Santos ringleader D'Esposito was accused by the liberal media of having an affair and then putting the woman on his payroll, but he was a dead man walking even before that. Molinaro went down in flames in CD-19 as well.
In another special election for Congress which took place in June, liberals cackled about Republican Michael Rulli's supposedly weak showing in Ohio's 6th congressional district, where he defeated a relatively penniless Democrat by "only" 9 points in a district which is typically much more GOP-leaning than that. We wrote about that outcome here and noted presciently that Rulli would have no trouble at all in the November rematch. He won by over 30 points. Special elections are often influenced heavily by organizational and motivational factors, and Republicans normally lack both of those in low-turnout elections which are little publicized on the right. Moving down to the state legislative level, in September, 2023 readers were scolded by some trembling GOP establishment blogger who calls himself "Bonchie" that Republicans had failed to learn from the numerous defeats of conservative candidates in 2022 and were still fielding bad (i.e. "conservative") candidates in special elections instead of nice, squishy, electable moderates. He specifically referenced New Hampshire where a conservative GOP nominee lost a 2023 special election in a microscopic state House (not congressional) district that was fraudulently described by the blogger as being solidly Republican. That Republican candidate, minister James Guzofski, did himself no favor by inviting the liberal media to portray him as a kook when he declared something like "Jesus told me that Donald Trump really won in 2020!", and the minister came out on the wrong end of a narrow decision in 2023. "Bonchie" concluded from this infinitesimal sample size that certain disaster awaited the GOP in the 2024 elections everywhere if they didn't heed his warning and run screaming to the left. Guzofski ran again in November, 2024 against the same Democrat who had defeated him in that 2023 special election where less than 3,000 people bothered to vote. This time Guzofski wasn't such a bad candidate after all -- over 50% of the voters chose him and Republicans swept all 3 state House seats in that New Hampshire district. In Florida a marginal state House district in the deteriorating Orlando area was vacated by an incumbent Republican, and the special election in January, 2024 went as expected: Democrat Tom Keen won by 2.6 points in a district which favors his party by about 2 points. As liberals were going bonkers about this "major upset" the massive GOP margin in the FL state House was merely reduced from 85-35 to 84-36. Hardly an occasion for panic, except for those who are easily rattled. What happened the next time a real election rolled around? Keen lost by nearly 4 points to Republican Erika Booth in this Democrat-leaning district, and once again those who had previously declared that the world was coming to an end were proven to be Chicken Littles. Another example: In a state House district which lies just north of Oklahoma City, liberals were outwardly cheerful despite yet another defeat because it was by a much closer margin than expected. Republican Erick Harris prevailed by only 5.3% in a February special election in a district that Democrats hadn't even contested since 2018. Nervous Nellies on the right got the vapors again. Democrats weren't fooled by the fluke outcome although they took the opportunity for some big talk. In November the Rats failed to come up with any nominee at all, and Harris trounced a Libertarian to easily hold the R+14 seat. The Rats never had a chance in this district, but acted as if they did and some idiots believed them. The lesson which should be learned here is -- most of the time, anyway -- there is nothing to be learned from low-turnout special elections, especially when they take place in puny little state House districts; and even more so when the balance of power won't be affected one iota no matter what the outcome is (like in Florida and Oklahoma). Occasionally special elections DO portend a future wave, as in 1993-94 when Republicans won U.S. House elections in places where they had never previously prevailed (like in OK-6 and KY-2) and came surprisingly close to winning in WI-1 which Democrats had held for a quarter-century at the time. Democrat Peter Barca almost lost in 1993 and did lose in 1994; the Rats have never won there again, nor have they ever won again in those Oklahoma and Kentucky districts. There will be 3 special elections to Congress coming up in the first few months of 2025: FL-1 (Matt Gaetz), FL-6 (Michael Waltz) and NY-21 (Elise Stefanik). These vacancies have occurred because the incumbents were nominated for positions in the second Trump administration, though Gaetz has since withdrawn. Each of these 3 districts are solidly Republican, and Democrats will not be winning any of them. But the liberal media will still be watching closely. When a Republican prevails easily, you'll never hear about it -- however if a Democrat does 0.1% better than expected it will be used as anti-Trump propaganda and described as a preview of a definite Republican bloodbath in the 2026 midterms. A bloodbath may in fact happen and the 2026 midterms may be similar to those of 2018, but that has nothing to do with these 3 elections. In all likelihood, what special elections in 2025 and 2026 will tell us about the future is. . . . nothing. Tags:
2024
House
Special (?) elections
| |||||||||||||||||||||||||||||||||||||||||||||||||||||||||||||||||||||||||||||||||||||||||||||||||||||||||||||||||||||||||||||||||||||||||||||||||||||||||||||||||||||||||||||||||||||||||||||||||||||||||||||||||||||||||||||||||||||||||||||||||||||||||||||||||||||||||||||||||||||||||||||||||||||||||||||||||||||||||||||||||||||||||||||||||||||||||||||||||||||||||||||||||||||||||||||||||||||||||||||||||||||||||||||||||||||||||||||||||||||||||||||||||||||||||||||||||||||||||||||||||||||||||||||||||||||||||||||||||||||||||||||||||||||||||||||||||||||||||||||||||||||||||||||||||||||||||||||||||||||||||||||||||||||||||||||||||||||||||||||||||||||||||||||||||||||||||||||||||||||||||||||||||||||||||||||||||||||||||||||||||||||||||||||||||||||||||||||||||||||||||||||||||||||||||||||||||||||||||||||||||||||||||||||||||||||||||||||||||||||||||||||||||||||||||||||||||||||||||||||||||||||||||||||||||||||||||||||||||||||||||||||||||||||||||||||||||||||||||||||||||||||||||||||||||||||||||||||||||||||||
| 11/6/2024: Congrats to President Trump! He Still Needs a House [RightDataUSA] | |||||||||||||||||||||||||||||||||||||||||||||||||||||||||||||||||||||||||||||||||||||||||||||||||||||||||||||||||||||||||||||||||||||||||||||||||||||||||||||||||||||||||||||||||||||||||||||||||||||||||||||||||||||||||||||||||||||||||||||||||||||||||||||||||||||||||||||||||||||||||||||||||||||||||||||||||||||||||||||||||||||||||||||||||||||||||||||||||||||||||||||||||||||||||||||||||||||||||||||||||||||||||||||||||||||||||||||||||||||||||||||||||||||||||||||||||||||||||||||||||||||||||||||||||||||||||||||||||||||||||||||||||||||||||||||||||||||||||||||||||||||||||||||||||||||||||||||||||||||||||||||||||||||||||||||||||||||||||||||||||||||||||||||||||||||||||||||||||||||||||||||||||||||||||||||||||||||||||||||||||||||||||||||||||||||||||||||||||||||||||||||||||||||||||||||||||||||||||||||||||||||||||||||||||||||||||||||||||||||||||||||||||||||||||||||||||||||||||||||||||||||||||||||||||||||||||||||||||||||||||||||||||||||||||||||||||||||||||||||||||||||||||||||||||||||||||||||||||||||||

November 5th was a wonderful night to be an American, and we get to begin enjoying the election results today!
Here are the districts which have been called and which have flipped from Democrat to Republican:
These initial districts flipped almost solely due to the effects of redistricting. In Alabama and Louisiana, racist court rulings mandated the ouster of White Republicans from the House and the substitution of black Democrats. In New York, Democrats belatedly gerrymandered the state earlier in 2024, but NY-22 was likely to be lost even without that factor. In North Carolina, an illegal Democrat gerrymander which had been in place in 2020 and 2022 was finally removed and replaced by a legitimate district map. The Michigan district was an open seat which was formerly held by Democrat Elissa Slotkin, who left to run for the Senate (and probably win, but that's not been called yet). Here are the other potential pickups for Republicans:
At one point on 11/6 DD saw a possible R+2 outcome in the House; they are predicting R-1 as of the evening of 11/8 and have been sticking to that number ever since. R-1 means they keep control, 220-215. Update 11/9: DD shows 11 House races uncalled and the GOP needs only to win 2 to maintain control; DD believes they will win 4 of the 11. Evans (R) is now ahead of Caraveo (D) in CO-8; Ciscomani (R) is clinging to life in AZ-6 and Begich (R) is ahead but still short of the necessary 50% in AK. All other undecided seats are in CA and Republicans lead in some of those too. Update 11/10: Golden may not win in ME-2 after all -- with all ballots counted he has fallen below 50% and therefore the race will be decided by Rigged Choice Voting just like it was in 2018 when that scheme was first used in Maine. Golden is still likely to win, but apparently not 100% certain at this point. Update 11/11: Most media called it on Sunday but now everybody says that Republicans have picked up CO-8. AZ-6 is still too close to call and they're all asleep in Alaska, where vote totals haven't moved in a long time. Republican incumbents will probably lose no more than 2 seats in CA (we hope) and there will be no pickups there, but in the end the House should stay (R). Update 11/12: It's over (as far as who will run the House) -- Republicans hold CA-41 and AZ-6 but lose CA-27. A net of minus-1 there may not sound impressive, and it's not, but it is sufficient to reach the 218 threshold; they are at 219 with possibly 2 more wins yet to come (AK and CA-13). If those wins materialize we'll wind up exactly where we started, with Republicans having a 221-214 advantage. That outcome may also sound unimpressive, but given the number of marginal districts which had to be defended, merely breaking even isn't bad at all and a slightly better outcome than realists like us projected for them. So far Trump has named 2 incumbent GOP House members to his administration, which will necessitate special elections in FL-6 (Waltz) and NY-21 (Stefanik). Those special elections should be easy wins for the Republicans. Final update: In mid-December the GOP lost the last 2 House elections to be called, both of them in California, and both in districts where Republican incumbents had been leading for over a month. Democrats were able to "harvest" enough ballots to put their candidates over the top just before time expired. The final count then is 220-215, a net loss of 1 seat for the GOP -- slightly better than we expected (-2 or a little worse) but far worse than the conventional "wisdom" which desperately envisioned House gains to go along with a presidential win. Tags:
2024
House?
We'll find out in December
| |||||||||||||||||||||||||||||||||||||||||||||||||||||||||||||||||||||||||||||||||||||||||||||||||||||||||||||||||||||||||||||||||||||||||||||||||||||||||||||||||||||||||||||||||||||||||||||||||||||||||||||||||||||||||||||||||||||||||||||||||||||||||||||||||||||||||||||||||||||||||||||||||||||||||||||||||||||||||||||||||||||||||||||||||||||||||||||||||||||||||||||||||||||||||||||||||||||||||||||||||||||||||||||||||||||||||||||||||||||||||||||||||||||||||||||||||||||||||||||||||||||||||||||||||||||||||||||||||||||||||||||||||||||||||||||||||||||||||||||||||||||||||||||||||||||||||||||||||||||||||||||||||||||||||||||||||||||||||||||||||||||||||||||||||||||||||||||||||||||||||||||||||||||||||||||||||||||||||||||||||||||||||||||||||||||||||||||||||||||||||||||||||||||||||||||||||||||||||||||||||||||||||||||||||||||||||||||||||||||||||||||||||||||||||||||||||||||||||||||||||||||||||||||||||||||||||||||||||||||||||||||||||||||||||||||||||||||||||||||||||||||||||||||||||||||||||||||||||||||||
| 11/2/2024: Election 2024: The Final Hours [RightDataUSA] | |||||||||||||||||||||||||||||||||||||||||||||||||||||||||||||||||||||||||||||||||||||||||||||||||||||||||||||||||||||||||||||||||||||||||||||||||||||||||||||||||||||||||||||||||||||||||||||||||||||||||||||||||||||||||||||||||||||||||||||||||||||||||||||||||||||||||||||||||||||||||||||||||||||||||||||||||||||||||||||||||||||||||||||||||||||||||||||||||||||||||||||||||||||||||||||||||||||||||||||||||||||||||||||||||||||||||||||||||||||||||||||||||||||||||||||||||||||||||||||||||||||||||||||||||||||||||||||||||||||||||||||||||||||||||||||||||||||||||||||||||||||||||||||||||||||||||||||||||||||||||||||||||||||||||||||||||||||||||||||||||||||||||||||||||||||||||||||||||||||||||||||||||||||||||||||||||||||||||||||||||||||||||||||||||||||||||||||||||||||||||||||||||||||||||||||||||||||||||||||||||||||||||||||||||||||||||||||||||||||||||||||||||||||||||||||||||||||||||||||||||||||||||||||||||||||||||||||||||||||||||||||||||||||||||||||||||||||||||||||||||||||||||||||||||||||||||||||||||||||||

Photo credit: CNN
With just a few more hours until the 2024 election campaign season mercifully concludes, we are on track for one of the closest elections in U.S. presidential history if the polls can be believed. But some folks are not so sure about that, and are thinking in terms of "waves" and "landslides" that will deliver not just the White House but also the U.S. House and Senate. For example (just from the past few days):
But also:
These polar-opposite worldviews are hardly unexpected; the fragile snowflakes on both sides (there are far more on the left, but no shortage on the right either) need to be constantly reassured that things are going their way, no matter what "lies" they may hear which say otherwise. Pay no attention to the man behind the curtain and believe everything we tell you, they say. Well, somebody is lying, and somebody is going to be crushingly disappointed on November 6th or whenever the vote-counting finally ceases. 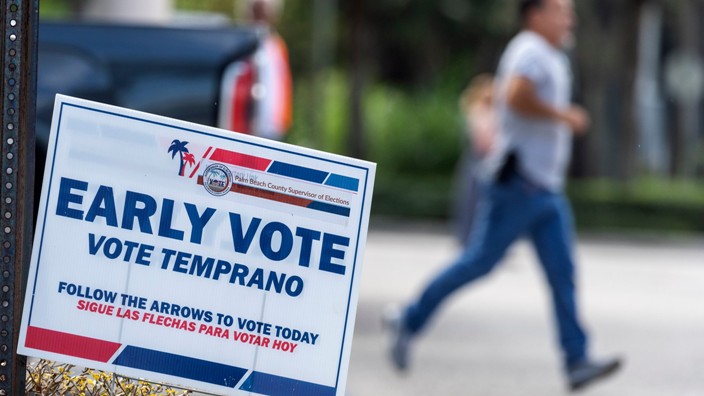
Photo credit: Palm Beach Post
Early Voting
In a nation as closely divided as this one, it appears that the potential for a "wave" that would sweep over the presidency, the Senate and the House is minimal. But it's not impossible. We'll say this much: if there is any kind of wave, it's probably going to be the kind we don't want to see. Republicans routinely underestimate the amount of hatred Democrats are capable of, and hatred is an excellent motivation for voting. 
Photo credit: Twitchy.com
The 2024 Presidential Election:
If this series of miniscule margins that generally favor Donald Trump -- ALL of which are within the margin of sampling error -- carry over to the actual vote counts, then Trump will prevail in the Electoral College by the count of 287 to 251 assuming all other states go as expected. Which means that the "Keystone" to the election is the state of Pennsylvania -- as we noted long ago and wrote about in considerable detail; it is tremendously likely that whoever wins PA wins the election. There are a couple of things to keep in mind about all of these pollsters who are showing exceedingly close races in several states at the presidential level, and in other races as well:
Photo credit: National Review
The Senate:
The potential bad news comes from Florida, Texas and even rock-solid crimson, burgundy, maroon Nebraska, where an "independent" phony-moderate candidate is supposedly within striking distance of squishy Republican incumbent Deb Fischer according to the far-left New York Times and the liberal candidate's own polls; all other polls forecast a normal Nebraska outcome. The Democrats did not even field a candidate here -- aside from the one who is calling himself an independent. Republicans are likely to hold all three of those seats. The Rats are flooding Florida and Texas with $$$ but it would still be quite an upset if Ted Cruz or Rick Scott were to lose; some now classify the TX race as a tossup. The saving grace for these two Republicans could be the laughably poor quality of their liberal Democrat opponents. But the usual Democrat formula of (money + lies + hate) = victory certainly could work. There's one important ingredient we left out of that equation, which helps Democrats greatly when money + lies + hate isn't quite sufficient. That ingredient is normally not added until after the votes are cast. 
Photo credit: The Hill
It's not necessarily about voters actually supporting the dim-bulb Democrats in FL & TX; it's more about voting against the Republicans. Neither Scott nor Cruz are popular with anything more than the tiniest majority of the electorate in their states. Trump is going to win Florida and Texas and even though casual observers will be surprised to hear that a coattail effect might be required for Scott and Cruz, that very well may be the case. We'll say they both pull it out in the end.
There are also lunatic fringe pipe dreams regarding Republican pickups in Maryland and Virginia. However the GOP has zero chance in Maryland and at most a 10% chance in the Virginia Senate race. But those other six states are going to be close, to one degree or another. Ohio and Wisconsin are the most likely pickups; Arizona (one outlier poll aside) and Nevada are the least likely. Pennsylvania and Michigan currently look improbable too. In any event, this is all gravy for the Republicans. They have nothing to lose in these states and everything to gain. The probability, however, is that they will gain nothing, or at most one. But it would take only a very slight shift to the right, and suddenly it could be another +2! Or more! All Senate polls are close in these marginal states and, on average, they all show the Republican losing. Final score: The most likely outcome is a net gain of 2 or perhaps 3 seats for the GOP, which means the breakdown will be 51-49 or 52-48 in the Republicans' favor starting in 2025. It may be assumed that any "wave", however low the probability is that one occurs, can only push things further in the Republican direction. But don't completely discount the possibility of an unpleasant surprise in Texas or Florida. Worst case scenario: the Senate stays 51-49 Democrat, and that is not terribly likely. 
Photo credit: Fox News
As far as the likely outcome: as we have noted on numerous occasions, having only 51 or 52 seats is not satisfactory to give the GOP anything but nominal control. There are at least two Republican senators -- Lisa Murkowski (Alaska) and Susan Collins (Maine) -- who are for all intents and purposes Democrats. They can continue to sabotage GOP efforts from within as the leadership would prefer; they can drop the charade and become Democrats; or they can go the "independent" route. Regardless, GOP "control" of the Senate will be largely illusory in every way aside from perhaps mathematics.
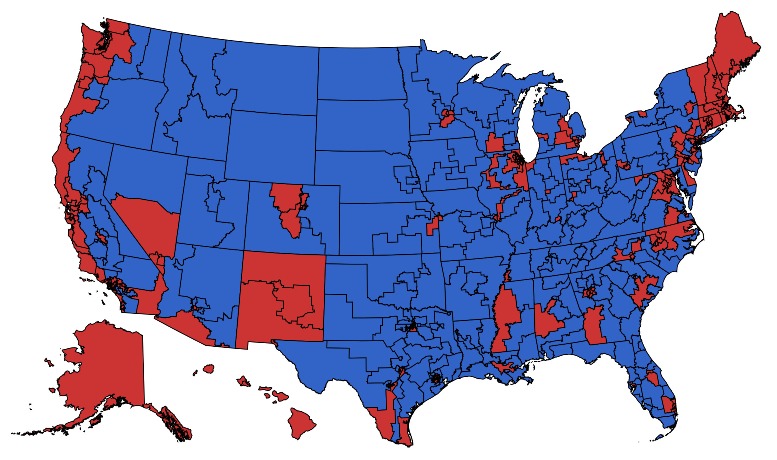
Current U.S. House breakdown by district (Map created using mapchart.net)
The House:
Democrats could get the +4 they need in New York and California alone. Republican freshmen (and some incumbents) won numerous close -- fluke -- elections in 2022 and a large portion of those outcomes are highly likely to be reversed. One already has been reversed (NY-3, Santos) in a special election. There are as many as five vulnerable GOP freshmen in New York. Two of the five (Brandon Williams, Anthony D'Esposito) appear to be near-certain losses. Two others (Marc Molinaro, Mike Lawler) are tossups at best. Numerous Republicans are on the hot seat in the Land of Fruits and Nuts. Endangered incumbents include John Duarte, David Valadao, Mike Garcia, Michelle Steele and Ken Calvert. It will be no surprise if at least two or three of those lose. Don't bother staying up late on election night to find out. California gives itself 30 days to count votes in order to facilitate "ballot harvesting" after election day. Thirty days apparently wasn't enough time for California Democrats in 2022; don't expect the same results in 2024. Unless an endangered California incumbent is solidly ahead prior to Ballot Harvesting Month, then he/she doesn't have much of a prayer of remaining in Congress. Republicans will pick up 3 seats in North Carolina due to the removal of the 2020/2022 illegal Democrat gerrymander. Republicans will lose 2 seats (one in Alabama, one in Louisiana) due to the impact of racist court rulings which have demanded that a White Republican be replaced by a black Democrat in both instances. Elsewhere, the list of likely ("likely" = "maybe a 50.1% chance" so don't get too excited) GOP pickups is a short one:
The list of likely GOP losses is longer, even without including the five endangered Californians:
Neither of these lists is exhaustive. For a wider range of possible House flips, read our report from a couple weeks ago. If there is any kind of movement off-center, one list or the other will expand. Based on all of the above expectations, the final outcome in the House is going to be exceedingly close. Republicans will need at least a small swing to the right in many districts in order to simply retain what they already possess; that swing is hardly a certainty. The likeliest outcome is that the GOP suffers a net loss of 2 to 8 seats. The results from 2022 in California and New York are what gave the Republicans the House during this past term; the results from those states in 2024 will be the ones which are primarily responsible for giving Democrats control beginning in 2025, if the House does in fact flip. State legislatures: Nearly all states are having legislative elections this year. Those elections are well under the radar as compared to the U.S. House, Senate and presidency, but they are hardly unimportant. In most places, partisan control of a state House or state Senate is not in much doubt. However there are a handful of states -- many of the same ones which are tossups at other levels too -- in which control of a state legislative body could easily flip from one party to the other. The ones that are most flippable include: Alaska: Both the House and especially the Senate are close, but it almost doesn't matter because even when the GOP has the numbers (as they always do) the liberal-RINO wing of the party conspires with liberal Democrats to form a "coalition" which ensures that conservative legislators are on the outside, and powerless. The House currently consists of 21 R, 13 D and 6 independents; the Senate has 11 R and 9 D -- with 8 Republicans and all 9 Democrats working together to seize control and exclude three conservative Republicans. Arizona: The Rats need ONE House seat (there are 31 R and 29 D) and ONE Senate seat (16 R, 14 D) to move from minority status into a tie. Obviously that means they need +2 to take full control of the state government. Michigan: Dems flipped both houses in 2022. Michigan Republicans are in an identical position to Arizona Democrats: +1 to tie, +2 to win. The House is 56 D, 54 R; the Senate is 20 D, 18 R. Neither Arizona nor Michigan are exactly known for election integrity lately, so temper your expectations accordingly. Minnesota: Republicans need a net gain of 1 seat in the Senate (34 D, 33 R) to win back what they lost control of in 2022. It will take a small wave (R+4) to get the House. New Hampshire: In a state where practically every neighborhood has its own representative (there are 400 seats in the House of this tiny state) things often fluctuate wildly. If they fluctuate just slightly to the left, Rats will get the House. The current breakdown is 201 R, 196 D, 3 I. Republicans have nominal control of the state Senate (14 R, 10 D). Pennsylvania: Could cause the fragile types to ingest a ton of copium next week if Cackles wins, Casey is re-elected, Perry loses, etc. Then add the Democrats going +3 and taking the state Senate (current breakdown: 28 R, 22 D) and by doing so seizing 100% control of PA government. The GOP is fighting hard and may avert disaster, at least in the state Senate. The Rats currently lead 102-101 in the state House and on a good election night the Republicans will take it back. On a bad night they won't. Wisconsin: The GOP has large majorities in both houses of the legislature.... today. In 2025, they won't. A Democrat gerrymander has been put in place for 2024 and when the votes are counted the Wisconsin House and Senate are going to look a lot like Pennsylvania's or Michigan's -- tossups all the way around. The Wisconsin GOP needs a good election night at all levels. Currently the splits are 22 R, 11 D in the Senate and 64 R, 35 D in the House. Enjoy it while you still can, Wisconsin Republicans. Tags:
2024
House
Senate
Presidency
Hope we're wrong about the House
| |||||||||||||||||||||||||||||||||||||||||||||||||||||||||||||||||||||||||||||||||||||||||||||||||||||||||||||||||||||||||||||||||||||||||||||||||||||||||||||||||||||||||||||||||||||||||||||||||||||||||||||||||||||||||||||||||||||||||||||||||||||||||||||||||||||||||||||||||||||||||||||||||||||||||||||||||||||||||||||||||||||||||||||||||||||||||||||||||||||||||||||||||||||||||||||||||||||||||||||||||||||||||||||||||||||||||||||||||||||||||||||||||||||||||||||||||||||||||||||||||||||||||||||||||||||||||||||||||||||||||||||||||||||||||||||||||||||||||||||||||||||||||||||||||||||||||||||||||||||||||||||||||||||||||||||||||||||||||||||||||||||||||||||||||||||||||||||||||||||||||||||||||||||||||||||||||||||||||||||||||||||||||||||||||||||||||||||||||||||||||||||||||||||||||||||||||||||||||||||||||||||||||||||||||||||||||||||||||||||||||||||||||||||||||||||||||||||||||||||||||||||||||||||||||||||||||||||||||||||||||||||||||||||||||||||||||||||||||||||||||||||||||||||||||||||||||||||||||||||||
| 10/17/2024: 2024 Election Analysis: Will Republicans Hold the House? [RightDataUSA] | |||||||||||||||||||||||||||||||||||||||||||||||||||||||||||||||||||||||||||||||||||||||||||||||||||||||||||||||||||||||||||||||||||||||||||||||||||||||||||||||||||||||||||||||||||||||||||||||||||||||||||||||||||||||||||||||||||||||||||||||||||||||||||||||||||||||||||||||||||||||||||||||||||||||||||||||||||||||||||||||||||||||||||||||||||||||||||||||||||||||||||||||||||||||||||||||||||||||||||||||||||||||||||||||||||||||||||||||||||||||||||||||||||||||||||||||||||||||||||||||||||||||||||||||||||||||||||||||||||||||||||||||||||||||||||||||||||||||||||||||||||||||||||||||||||||||||||||||||||||||||||||||||||||||||||||||||||||||||||||||||||||||||||||||||||||||||||||||||||||||||||||||||||||||||||||||||||||||||||||||||||||||||||||||||||||||||||||||||||||||||||||||||||||||||||||||||||||||||||||||||||||||||||||||||||||||||||||||||||||||||||||||||||||||||||||||||||||||||||||||||||||||||||||||||||||||||||||||||||||||||||||||||||||||||||||||||||||||||||||||||||||||||||||||||||||||||||||||||||||||
Current U.S. House breakdown by district (Map created using mapchart.net)
1. Competitiveness
That last one is a biggie, but the others are also important. Regarding the suitability of the candidates: Democrats always try to run the most liberal candidates possible in House races, but in a marginal district they must (with the help of their army of media allies) attempt to disguise their nominee as a "moderate" because they understand that most voters in a marginal district would find an in-your-face liberal nutbucket to be repugnant. Once elected, Democrat "moderates" normally march in goose-step with their liberal colleagues. Even when narrowly in the minority as is the case today in the House, Democrats voting as a united bloc is nearly always sufficient to thwart any unwanted legislation. This happens because there are always enough liberal Republicans in the party's "big tent" to cross over and assist the Democrats whenever the Republican establishment (GOPe) desires for that to occur. Sometimes, particularly on legislation which has no chance of passing the Senate or being signed into law, the Democrat puppetmasters will permit their most vulnerable House members to temporarily leave the plantation and cast a non-liberal vote. Which they can then highlight to the voters back home as a sign of their alleged "independence" when re-election time rolls around. Of course there is no real independence; they vote as they are told to -- always. Those who control the Republican party (and especially its purse strings) also seek to run the most liberal candidates possible in House races -- even in solid Republican districts -- because the GOPe finds anyone who is even remotely conservative to be repugnant. On this topic, the leadership of both parties are in agreement. Occasionally, the GOPe is correct in running a moderate-liberal if the nature of the district is inappropriate for a nominee who is perceived as being too far to the right. Based on the above criteria, we have identified 62 districts which should be competitive this year. This list is not substantially different from the one we published over a year and a half ago, but the data associated with these districts is now up-to-date. In addition to the potential flippers, there's also one district in Washington which features two Republicans and zero Democrats running; the incumbent Republican is a Trump-hating impeachment RINO while the challenger is a solid conservative. If an upset should occur there it won't count as a GOP pickup since they already hold that seat, but it would be a welcome development nonetheless. 2. Background After the 2022 elections, Republicans controlled the House by the margin of 222-213. Since that time there have been 8 special elections held to replace representatives who retired or died. Seven of those 8 were won by the same party which originally held the seat. The lone exception occurred in New York in February when Democrats won the special election in NY-3 to replace conservative Republican George ("Miss Me Yet?") Santos. That election was necessitated when the Stupid Party decided to expel Santos from Congress in December, 2023 for allegedly being so corrupt that he might as well have been a Democrat. But he voted like a conservative which, come to think of it, probably didn't help his case with the party leadership. The have been three other resignations or deaths for which special elections have not yet been held (or will not be held), and the GOP currently has a 220-212 advantage in the House. Because two of the three vacancies exist in solid Democrat districts (NJ-9, TX-18) which will be easily retained in November, the Democrats effectively have 214 seats going into the election which means they require a net gain of merely 4 seats to seize control. 3. Belated Redistricting Congressional redistricting -- the redrawing of U.S. House district lines -- took place in all states prior to the 2022 elections, except of course in the six (Alaska, Delaware, North Dakota, South Dakota, Vermont and Wyoming) which have only one district that comprises the entire state and therefore there are no district lines. After 2022 however, a handful of states redrew their districts. This will have a net effect of close to zero on the partisan composition of Congress in 2025, but will result in significant changes within the affected states. In North Carolina the Democrat-controlled state Supreme Court in 2020 (and then again in 2022) chose to illegally bypass the Republican-controlled legislature and mandated district lines which favored Democrats. In 2022 the voters of the Tarheel State delivered a GOP majority to the Court. The Court then began acting lawfully and returned the task of line-drawing to the legislature, where it belongs. As a result, Republicans will almost certainly be picking up three House seats (NC-6, NC-13, NC-14) from Democrats on election day. However this windfall will be negated by redistricting-related outcomes in Alabama, Louisiana and New York. In the two southern states, partisan Democrat judges demanded that two conservative White Republicans (one in Alabama, one in Louisiana) be replaced in the House by two liberal black Democrats. Barry Moore (AL-2) and Garret Graves (LA-6) are the two Republicans who will be out of work after 2024 because of these racist court rulings. In New York, Democrats in 2022 were forced to settle for a district map that was only a slight improvement over the one from which they had benefitted in 2020; they had tried for a hyper-partisan gerrymander which would have all but eliminated Republicans (it would have been something like 22 Democrats and just 4 Republicans) from the New York congressional delegation. In March of 2024, New York Democrats tried once again to gerrymander the state's congressional districts in their favor, and they succeeded without any resistance from the GOP. We wrote about this in detail at the time it occurred. Having already picked up NY-3 in the Santos debacle, NY Democrats ensured that their pickup would not revert to the GOP in November (and it won't). Additionally, they have altered the Syracuse-Utica area district of freshman Republican Brandon Williams to severely endanger him, making it all but certain for the Democrats to go +1 in New York. At least +1. Redistricting greatly altered no other New York districts, though it did make NY-18 a little safer for liberal freshman Democrat Pat Ryan. However it always was probable that New York and California would be bloodbaths for the Republicans in 2024. That logical assertion is based on the sheer number of close (fluke) House wins which the GOP somehow achieved in those liberal states in 2022, and many close/fluke outcomes were likely to be reversed in 2024 with or without the assistance of Democrat gerrymandering. One other state -- Georgia -- redrew its lines after 2022 by a court order similar to the one which affected Alabama and Louisiana. Democrats have been fuming ever since that ruling came down because Republicans found a way to comply with the racist ruling without sacrificing any of their currently-held seats. We also wrote about that in detail at the time it occurred. Even counting New York at only -1 for the Republicans, that, along with the -2 which is guaranteed from Alabama and Louisiana means a break-even as the result of belated redistricting despite the upcoming GOP bonanza in North Carolina. 4. The 62 Most-Flippable Districts These do not include the North Carolina, Alabama and Louisiana districts already mentioned above, but does include NY-22 (Williams) because it is not quite 100% certain that the district will be won by a Democrat. The following 62 districts are the ones which should be strongly sought by both parties -- but it doesn't work out that way in all cases, as we will illustrate. Several of the listed districts, mostly ones held by Democrats, are not very likely to flip despite the vulnerability of the Democrat incumbents. Or at least not nearly as likely as they should be, mainly because the GOP does not have infinite funds to work with, while the Democrats (via their "ActBlue" money laundry) apparently do. Some are finally beginning to catch on to the illegal activities of ActBlue, but it's too late to do anything about it in this election cycle and Democrats are likely to be able to purchase a significant number of House and Senate seats which might otherwise be far more tenuous. Here are the 62 most likely potential flippers, by region. The bloodiest battlegrounds are highlighted, and some which probably won't be so bloody come with brief explanations. Northeast (16):
Mid-Atlantic (3):
South (2):
Midwest (13):
Great Plains-Mountain West (8):
West (20):
As noted above, the most competitive districts are bolded. A little more (34) than half of the listed districts fit that description. Of these 34, 11 are currently held by Democrats and 23 by Republicans. That's not a good ratio. There are some others which are perhaps a small amount behind in terms of competitiveness. They are:
Three of those are currently GOP districts and three are held by Democrats. Add them to the 34 super-contested districts and the Republicans have the potential to lose 26 marginal seats, the Democrats 14. The 40 most competitive districts are mostly in states which are toss-ups at the presidential level (AZ, MI, NC, NV, PA, WI) or ones which the bumbling Word Salad Queen is guaranteed to win (CA, CO, NE*, NJ, NM, NY, OR, VA, WA). Only six of the 40 battleground districts lie in states that Trump should win (AK, IA, ME*, MT, TX). Eleven lie in the swing states and 23 are in states where Trump's probability of victory ranges from "very unlikely" to "utterly impossible". If there is any presidential coattail effect in that latter group, it is hardly going to be beneficial for GOP House candidates. [* ME-2 and NE-2 are in states which split electoral votes. Trump is likely to win ME-2 and lose NE-2, replicating the 2020 outcome in those two districts.] In these 40 districts, Democrats have raised more money in 30 of them and have spent more money in 30 of them. Republicans have the financial edge in only 10 of the 40. As we've stated several times before: there is no election in this country, at any level, in which Democrats cannot outspend Republicans (often by astronomical amounts) if they wish to do so. Money alone doesn't determine the outcome of an election, but having more than your opponent surely doesn't hurt. The results in the other districts listed above are not likely to be as close as they should be. Republicans are not trying as hard as they might in R-leaning districts like KS-3, OH-9, OH-13 and PA-7. They are also not terribly competitive in some districts which lean only slightly to the left (in the D+1 to D+4 range) such as IL-17, MD-6, MI-3, MN-2, NV-3, NV-4, OH-1, PA-17 and TX-28. These represent blown opportunities, although if a "red" wave somehow materializes there may be some pleasant surprises here. There are about a dozen districts which have not been mentioned previously but could change partisan hands in November; it would require moderate to major upsets in order to wind up doing so. Some of these are really just pipe dreams for one party or the other, and the majority of them are not even being seriously contested (financially) although some are. We enumerate them just to cover all the bases:
5. Conclusion Add it all up and the probability of the GOP remaining in charge of the House appears to be less than 50% (perhaps much less), barring a clear shift to the right between now and November 5. As we have documented, there are likely to be more tight races in Republican-held districts than there will be in Democrat-held ones. Anything can happen in a close election, in case you've somehow forgotten 2020. Even if the GOP wins as many as half of the most precarious 40 districts, which is by no means certain to happen, that would make it +6 for the Democrats and 220-215 control of the House. When Democrats rule a legislative body by even one seat, they govern with an iron fist as if they have 100% control; when Republicans face the same margins -- as they currently have in the House and will in the Senate next year -- they become even more timid than usual (they aren't really comfortable with the concept of "governing") and act as if they have control of nothing. Which, in effect, they don't. And good luck with Senate "control" anyway with traitors like Lisa Murkowski, Susan Collins and Lindsey Graham in the GOP caucus -- assuming that none of them switch parties after 2024. The difference between how the parties behave in advantageous situations will be quite evident beginning in January, unless the Republicans can stem the tide of potential House losses and cling to power, such as it is with a twerp like Mike Johnson in command. As spineless as the GOP leadership is, that party's control of the House at least means that the Trump agenda (assuming he wins the presidency) is not immediately D.O.A. as it would be under racist election-denying Speaker Hakeem Homeboy, and it also means we would avoid a never-ending series of Trump impeachments. Vote hard. Tags:
2024
House
"Red" wave in the House?
Not likely
| |||||||||||||||||||||||||||||||||||||||||||||||||||||||||||||||||||||||||||||||||||||||||||||||||||||||||||||||||||||||||||||||||||||||||||||||||||||||||||||||||||||||||||||||||||||||||||||||||||||||||||||||||||||||||||||||||||||||||||||||||||||||||||||||||||||||||||||||||||||||||||||||||||||||||||||||||||||||||||||||||||||||||||||||||||||||||||||||||||||||||||||||||||||||||||||||||||||||||||||||||||||||||||||||||||||||||||||||||||||||||||||||||||||||||||||||||||||||||||||||||||||||||||||||||||||||||||||||||||||||||||||||||||||||||||||||||||||||||||||||||||||||||||||||||||||||||||||||||||||||||||||||||||||||||||||||||||||||||||||||||||||||||||||||||||||||||||||||||||||||||||||||||||||||||||||||||||||||||||||||||||||||||||||||||||||||||||||||||||||||||||||||||||||||||||||||||||||||||||||||||||||||||||||||||||||||||||||||||||||||||||||||||||||||||||||||||||||||||||||||||||||||||||||||||||||||||||||||||||||||||||||||||||||||||||||||||||||||||||||||||||||||||||||||||||||||||||||||||||||||
|
First page Previous page Next page Last page
This is page 1 of 10 | |||||||||||||||||||||||||||||||||||||||||||||||||||||||||||||||||||||||||||||||||||||||||||||||||||||||||||||||||||||||||||||||||||||||||||||||||||||||||||||||||||||||||||||||||||||||||||||||||||||||||||||||||||||||||||||||||||||||||||||||||||||||||||||||||||||||||||||||||||||||||||||||||||||||||||||||||||||||||||||||||||||||||||||||||||||||||||||||||||||||||||||||||||||||||||||||||||||||||||||||||||||||||||||||||||||||||||||||||||||||||||||||||||||||||||||||||||||||||||||||||||||||||||||||||||||||||||||||||||||||||||||||||||||||||||||||||||||||||||||||||||||||||||||||||||||||||||||||||||||||||||||||||||||||||||||||||||||||||||||||||||||||||||||||||||||||||||||||||||||||||||||||||||||||||||||||||||||||||||||||||||||||||||||||||||||||||||||||||||||||||||||||||||||||||||||||||||||||||||||||||||||||||||||||||||||||||||||||||||||||||||||||||||||||||||||||||||||||||||||||||||||||||||||||||||||||||||||||||||||||||||||||||||||||||||||||||||||||||||||||||||||||||||||||||||||||||||||||||||||||